Question
Question: Figure shows the x-t plot of a particle in one-dimensional motion. Two different equal intervals of ...
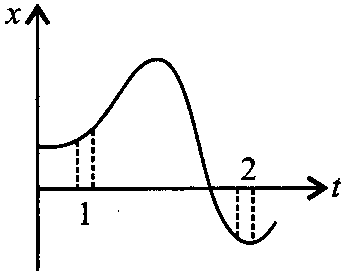
Figure shows the x-t plot of a particle in one-dimensional motion. Two different equal intervals of time are shown. Let v1and v2be average speed in time intervals 1 and 2 respectively. Then
A
v1>v2
B
v2>v1
C
v1=v2
D
Data is insufficient
Answer
v1>v2
Explanation
Solution
The average speed in a small interval of time is equal to the slope of x-t graph during that interval. As slope of interval 1 > slope of interval 2
∴v1>v2