Question
Question: Figure shows the displacement (x)-time (t) graph of the particle moving on the x-axis. <img src="ht...
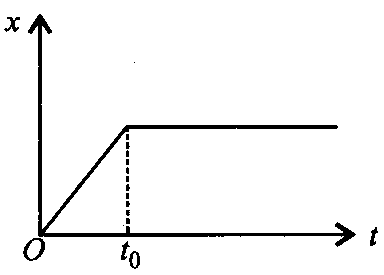
Figure shows the displacement (x)-time (t) graph of the particle moving on the x-axis.
A
The particle is at rest
B
The particle is continuously going along x-direction
C
The velocity of the particle increases upto time t0and then becomes constant
D
The particle moves at a constant velocity up to a time t0and then stops
Answer
The particle moves at a constant velocity up to a time t0and then stops
Explanation
Solution
The displacement – times graph is a straight line inclined to time axis upto times t0indicates a uniform velocity . After times t0the displacement- times graph is a straight line parallel to time axis indicates particle at rest.