Question
Question: Figure shows a potentiometer in which resistance of rheostat is changing with time \( \left( t \righ...
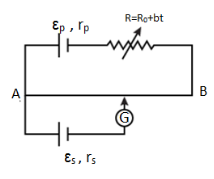
Figure shows a potentiometer in which resistance of rheostat is changing with time (t) as R=R0+bt , where R0 and b are positive constant. Which of the following graphs best represents the balance length l (from A ) with respect to time t ? (Symbols have their usual meaning)
(A) 
(B) 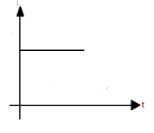
(C) 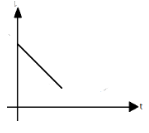
(D) 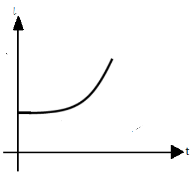
Solution
Hint : In order to solve this question, we are going to first see the formula for the potentiometer representing the lengths, then by putting the values for the corresponding lengths and simplifying the relation, the equation is obtained for the graph that shows the nature of the curve.
For a potentiometer, if l1 and l2 are the two lengths of across the galvanometer, then,
x1l1=x2l2
Complete Step By Step Answer:
As for the potentiometer given in this question, we know that if l1 and l2 are the two lengths of across the galvanometer, then,
x1l1=x2l2
Putting here the values of the all four variables, we get the equation,
(rp+R+R0εp)lpRl0=(rp+bt+R+R0εp)lpRl1
From this equation, we get to see here that,
{l_1} = {l_0} + \dfrac{{{l_0}bt}}{{{R_0} + R + {r_p}}} \\\
\Rightarrow {l_1} = {l_0}\left[ {1 + \dfrac{{bt}}{{{R_0} + R + {r_p}}}} \right] \\\
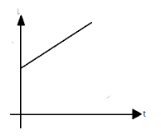
This equation here represents the first graph (A) with the intercept l0 on Y-axis.
Hence, the correct option is (A).
Note :
A potentiometer is an instrument for measuring voltage or 'potential difference' by comparison of an unknown voltage with a known reference voltage. If a sensitive indicating instrument is used, very little current is drawn from the source of the unknown voltage. The principle of a potentiometer is that the potential dropped across a segment of a wire of uniform cross-section carrying a constant current is directly proportional to its length.