Question
Question: $\newline$ $\newline$ $P_1$ $\newline$ $P_A$ $\newline$ $P_B$ $\newline$ $P_C$ $\newline$ $V_1$ $\ne...
P1 PA PB PC V1 V2 V→ till a fix V2 volume P1,V1,T1 more Γ
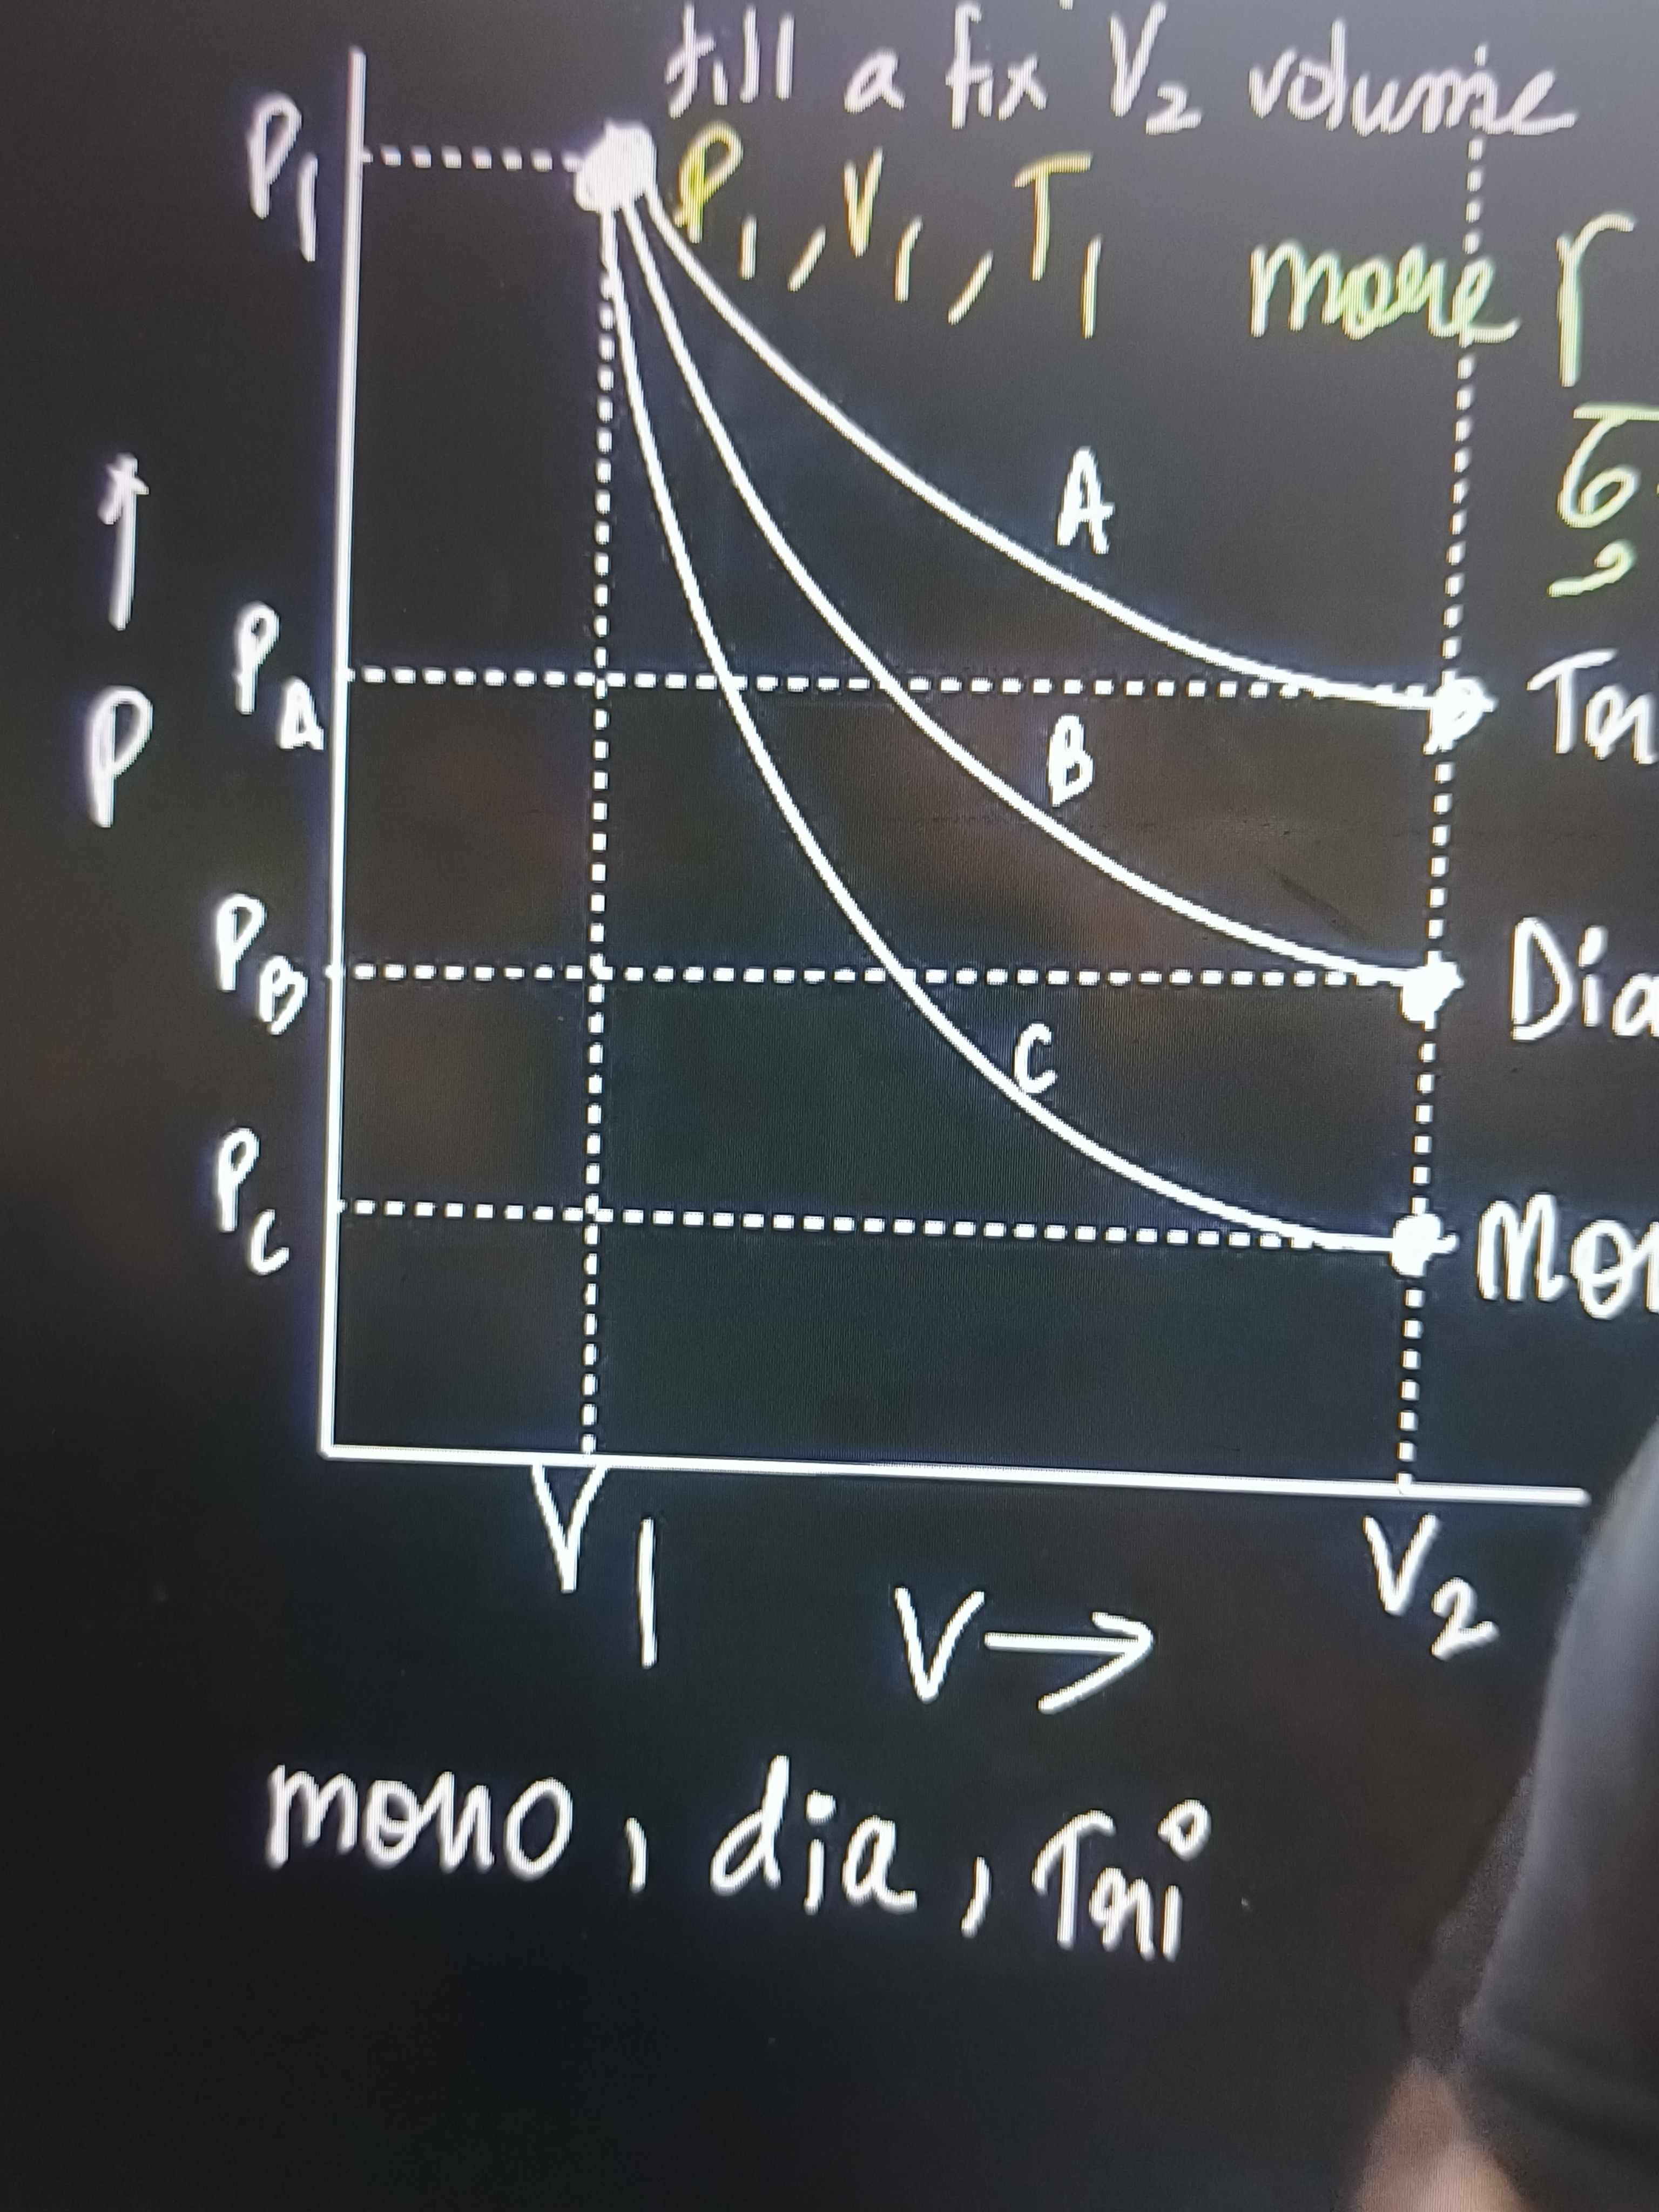
A corresponds to Triatomic, B to Diatomic, C to Monoatomic
Solution
The problem presents a P-V diagram showing three adiabatic expansion curves (A, B, C) starting from a common initial state (P1,V1) and expanding to a common final volume V2. The final pressures are PA,PB,PC respectively, with PA>PB>PC. The curves are labeled "Tri", "Dia", and "Mono" at their respective final points. We need to understand the physical principle behind this representation.
For an adiabatic process, the relationship between pressure and volume is given by: PVγ=constant where γ=CvCp is the adiabatic index (or Poisson's ratio).
Let's consider the expansion from an initial state (P1,V1) to a final state (Pf,V2). P1V1γ=PfV2γ The final pressure Pf can be expressed as: Pf=P1(V2V1)γ
In this problem, V2>V1, so the ratio V2V1 is less than 1. Let k=V2V1, where 0<k<1. So, Pf=P1kγ.
Now, let's recall the values of γ for different types of ideal gases (assuming moderate temperatures where vibrational modes are not excited):
-
Monoatomic gas: Degrees of freedom (f) = 3 (translational). The adiabatic index is γmono=1+f2=1+32=35≈1.67.
-
Diatomic gas: Degrees of freedom (f) = 5 (3 translational + 2 rotational). The adiabatic index is γdia=1+f2=1+52=57=1.4.
-
Triatomic gas (non-linear): Degrees of freedom (f) = 6 (3 translational + 3 rotational). The adiabatic index is γtri=1+f2=1+62=34≈1.33. (Note: If the triatomic molecule is linear, like CO2, its degrees of freedom for rotation are 2, making f=5 and γ=1.4. However, in such comparative problems, "triatomic" usually refers to the general non-linear case unless specified, implying a distinct γ from diatomic).
Comparing the γ values, we have the order: γmono(≈1.67)>γdia(1.4)>γtri(≈1.33)
From the graph, for the same expansion from V1 to V2, the final pressures are observed to be: PA>PB>PC.
Now, let's relate the final pressure Pf to γ using Pf=P1kγ where 0<k<1. Since k<1, as the exponent γ increases, the value of kγ decreases. Consequently, Pf decreases as γ increases. This means:
- The gas with the smallest γ will have the highest final pressure (Pf).
- The gas with the largest γ will have the lowest final pressure (Pf).
Applying this to the observed pressures from the graph:
- Curve A results in the highest final pressure (PA). This implies that the gas undergoing process A has the smallest γ. Therefore, Curve A corresponds to a Triatomic gas (γtri≈1.33).
- Curve B results in an intermediate final pressure (PB). This implies that the gas undergoing process B has an intermediate γ. Therefore, Curve B corresponds to a Diatomic gas (γdia=1.4).
- Curve C results in the lowest final pressure (PC). This implies that the gas undergoing process C has the largest γ. Therefore, Curve C corresponds to a Monoatomic gas (γmono≈1.67).
This analysis is consistent with the labels provided in the diagram:
- Curve A is labeled "Tri".
- Curve B is labeled "Dia".
- Curve C is labeled "Mono".
The slope of an adiabatic curve on a P-V diagram is given by dVdP=−γVP. For a given initial point (P1,V1), a larger γ implies a steeper negative slope. Visually, curve C is the steepest, followed by B, and then A is the least steep, which also confirms γC>γB>γA.