Question
Question: $i_m \sin \omega t_1$ $v_m \sin \omega t_1$ $v$ $i$ $V$ $I$ $\omega t_1$ $0 \quad \omega t_1...
imsinωt1
vmsinωt1
v
i
V
I
ωt1
0ωt1π2πωt
Answer
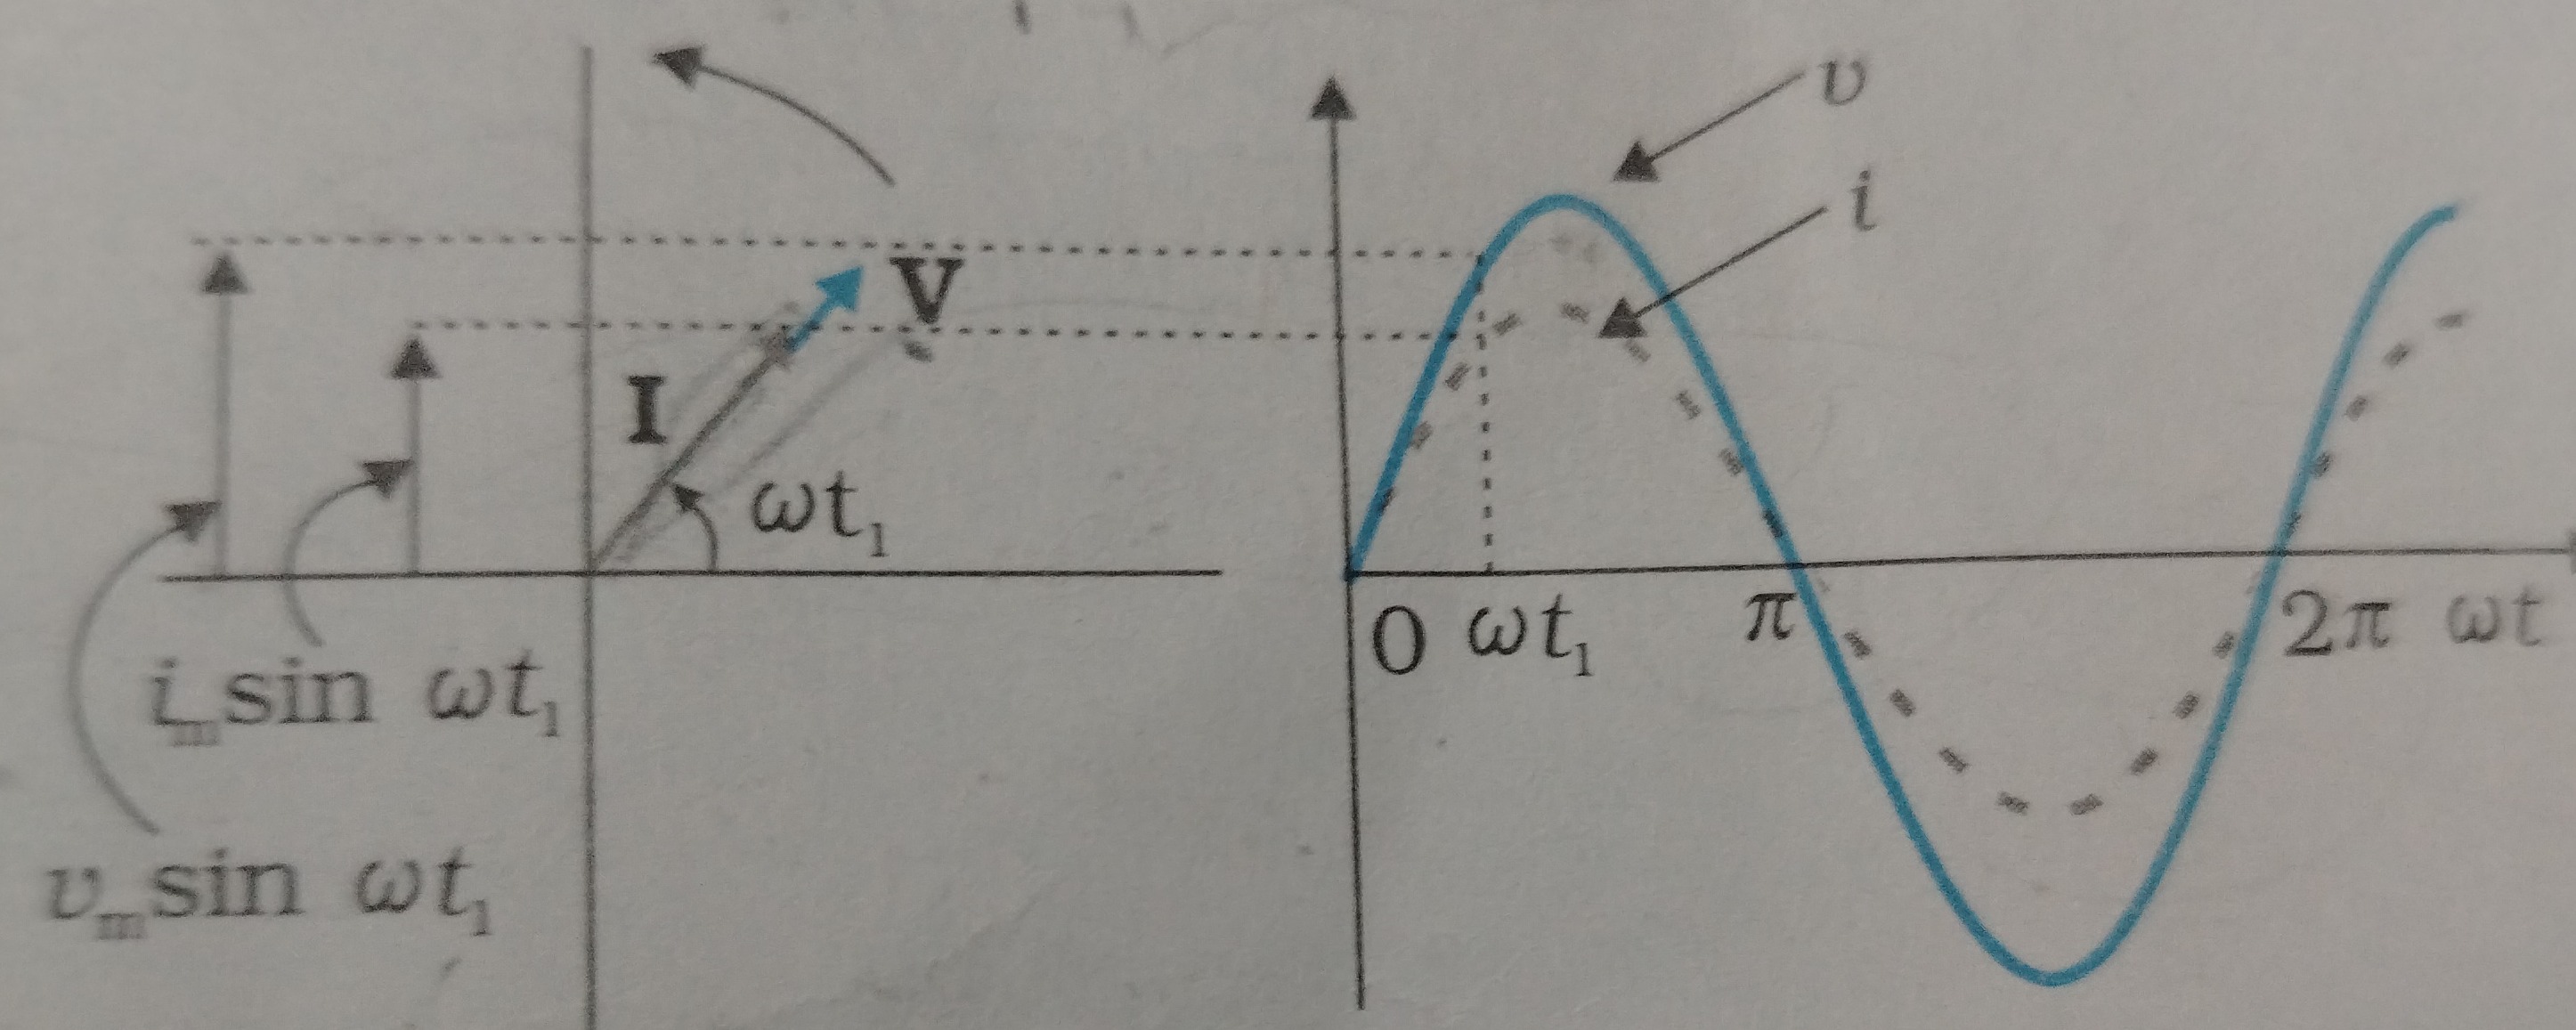
The image displays a comprehensive representation of alternating current (AC) voltage and current, utilizing both a phasor diagram and a waveform diagram. This type of diagram is typically used to illustrate the phase relationship between voltage and current in an AC circuit, here showing voltage leading current, which is characteristic of an inductive circuit (or an R-L circuit).
Explanation
Solution
The diagram consists of two main parts:
- Phasor Diagram (Left): This part uses rotating vectors (phasors) to represent the peak (or RMS) values and phase relationships of voltage and current.
- Waveform Diagram (Right): This part shows the instantaneous values of voltage and current as sinusoidal functions of time (or angular position ωt).
Let's interpret each label provided:
i_m sin ωt₁: This label points to the instantaneous value of the currentiat the specific angular position ωt1. In the phasor diagram, it represents the vertical projection of the current phasorIonto the y-axis, which corresponds to the instantaneous current i(ωt1).v_m sin ωt₁: This label points to the instantaneous value of the voltagevat the specific angular position ωt1. In the phasor diagram, it represents the vertical projection of the voltage phasorVonto the y-axis, which corresponds to the instantaneous voltage v(ωt1).v: This label refers to the solid blue sinusoidal curve in the waveform diagram. It represents the instantaneous voltage waveform, showing how voltage varies with time.i: This label refers to the dashed sinusoidal curve in the waveform diagram. It represents the instantaneous current waveform, showing how current varies with time. From the diagram, it is clear that the currentilags the voltagev.V: This label points to the longer vector in the phasor diagram. It represents the voltage phasor, which signifies the peak (or RMS) value of the alternating voltage. Its angle with the horizontal axis indicates its phase at a given instant.I: This label points to the shorter vector in the phasor diagram. It represents the current phasor, which signifies the peak (or RMS) value of the alternating current. It is shown lagging the voltage phasorV.ωt₁: This label indicates a specific instantaneous angular position or phase angle on both the phasor and waveform diagrams. In the phasor diagram, it's the angle of the voltage phasorVfrom the positive x-axis. In the waveform diagram, it's a specific point on the horizontal axis where the instantaneous values are observed.0,π,2π,ωt: These are labels on the horizontal axis of the waveform diagram.ωtis the independent variable representing the angular position or phase.0,π, and2πrepresent specific phase angles corresponding to the start of a cycle, half a cycle, and a full cycle, respectively.