Question
Question: During the medical check-up of 35 students of a class, their weights were recorded as follows: W...
During the medical check-up of 35 students of a class, their weights were recorded as follows:
| Weight (in kg) | Number of students |
|---|---|
| Less than 38 | 0 |
| Less than 40 | 3 |
| Less than 42 | 5 |
| Less than 44 | 9 |
| Less than 46 | 14 |
| Less than 48 | 28 |
| Less than 50 | 32 |
| Less than 52 | 35 |
Draw a less than type ogive for the given data. Hence, obtain the median weight from the graph and verify the result by using formula.
Solution
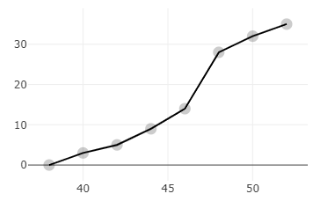
To, draw an ogive of the given data set, we will have to find the cumulative frequency at each interval. After that, we can plot a graph of marks vs cumulative frequency. As it is mentioned to draw a “less than” ogive where the cumulative frequency increases with each class considered.
Then to find the median we will just take half of the total frequency and mark that point image in the graphs. After that find the median by the formula l+f2N−cfh.
Complete step-by-step answer:
Now, as we have the values of cumulative frequency at each interval, we can plot a graph between the upper limit of each interval and the cumulative frequency at that class. Remember, the reason why we are plotting the graph with the upper limit of the interval is that we are drawing a “less than” type ogive where the cumulative frequency at an interval is less than the upper limit of that interval.
Now, for the median, we will have to find 2N, where N is the total frequency which is equal to 35 here.
Now, we will draw a straight line from 17.5, and wherever it will meet on the x-axis, that will be our median.
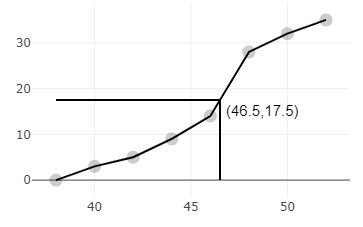
The median weight from the ogive is 46.5.
Now, find the frequency of each class interval,
| Class Interval | Cumulative Frequency | Frequency |
|---|---|---|
| 36 – 38 | 0 | 0 |
| 38 – 40 | 3 | 3 – 0 = 3 |
| 40 – 42 | 5 | 5 – 3 = 2 |
| 42 – 44 | 9 | 9 – 5 = 4 |
| 44 – 46 | 14 | 14 – 9 = 5 |
| 46 – 48 | 28 | 28 – 14 = 14 |
| 48 – 50 | 32 | 32 – 28 =4 |
| 50 – 52 | 35 | 35 – 32 = 3 |
Here the sum of the frequencies is N=35.
Now the value of 2N is,
⇒2N=235=17.5
The value of 2N lies in the interval 46 – 48.
So, the median class is 46 – 48.
The lower limit of the median class is,
⇒l=46
Cumulative frequency of class preceding the median class is,
⇒cf=14
The frequency of the median class is,
⇒f=14
The height of the class is,
⇒h=46−44=2
Then the value of the median is given by,
Median =l+f2N−cfh
Substitute the values,
⇒ Median =46+[1417.5−14]×2
Subtract the value in the numerator and multiply with 2,
⇒ Median =46+147
Divide numerator by the denominator,
⇒ Median =46+0.5
Add the terms,
∴ Median =46.5
Hence it is verified.
Note: We should plot the upper-class limits, not the lower-class limits. If we plot lower class limits it would give the wrong ogive of the distribution. We should plot cumulative frequency not frequency. Do not plot cumulative frequency on X-axis and the upper limit on Y-axis.