Question
Question: Draw the pressure-temperature and volume-temperature diagram for an isobaric process of expansion, c...
Draw the pressure-temperature and volume-temperature diagram for an isobaric process of expansion, corresponding ton moles of an ideal gas at pressure P0, from V0 to 2V0.
Solution
In this question, apply the condition of the isobaric process that is constant pressure process in the ideal gas equation to obtain the variation of the temperature as the volume of the gas increases from V0 to 2V0.
Complete step by step solution:
As we know that at low pressures and high temperatures, where the molecules of the gas move almost independently of one another, all gases obey an equation known as the ideal gas equation.
We can write the ideal equation as,
PV=nRT
Where, the pressure of the gas is P, the volume of the gas is V, n is the number of moles of the gas is n and the universal gas constant is R. The value of the universal gas constant is 8.3145Jmol−1K−1.
As we know that the isobaric process is a thermodynamic process in which the pressure remains constant.
Now, write the ideal gas equation in term of initial pressure P0 and initial volume V0, to obtain the initial temperature expression as
P0V0=nRT1
Now, we rearrange the above equation as,
⇒T1=nRP0V0
Similarly, we obtain for the final temperature,
P0(2V0)=nRT2
⇒T2=nR2P0V0
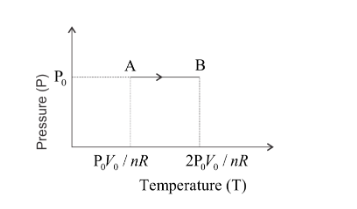
So, when the temperature varies from T1 to T2 the pressure is constant thus the graph of pressure versus temperature will be straight line normal to the pressure axis as show below,
For the isobaric process, the ideal gas equation can be written as,
PV=nRT
⇒V∝T
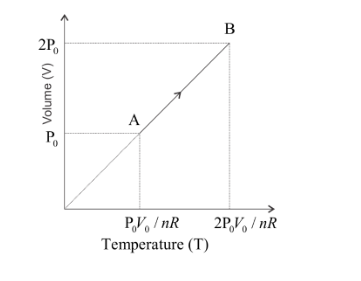
As the volume increases from V0 to 2V0, the pressure remains constant. Hence, the volume of the gas will be directly proportional to the temperature and we get the linear graph for the temperature vs volume diagram as shown below,
Note:
Make sure that if we use a number of moles in the equation of the ideal gas, the universal gas constant will be used that is PV=nRˉT and if we use mass of the ideal gas, then the characteristic gas constant will be used that is PV=mRT.