Question
Question: Draw the graphs of the equations \( x-y+1=0 \) and \( 3x+2y-12=0 \) . Determine the coordinates of t...
Draw the graphs of the equations x−y+1=0 and 3x+2y−12=0 . Determine the coordinates of the vertices of the triangle formed by these lines and the x - axis, and shade the triangular region.
A. A(1,3) , B(−1,6) and C(4,0)
B. A(2,5) , B(−1,6) and C(2,0)
C. A(−2,5) , B(−1,6) and C(2,0)
D. A(2,3) , B(−1,0) and C(4,0)
Solution
In this problem, they have asked to draw the graphs of the two equations x−y+1=0 and 3x+2y−12=0. To draw the graph of a line ax+by+c=0 , we need to calculate the value of either x or y from the given equation. Now we will consider a particular range say x∈[−2,2] or y∈[−2,2] based on which value you have calculated from the given equation we will take the region of the independent variable and calculates how the dependent variables vary according to different values of the independent variable. After getting all corresponding values, we will make them as coordinates and plot them on the graph. Now they have asked to find the coordinates of the triangle formed by these lines and the x-axis. For this, we use the graphs we have plotted before and from the plots, we can determine the vertices.
Complete step by step answer:
Given that,
x−y+1=0 and 3x+2y−12=0 .
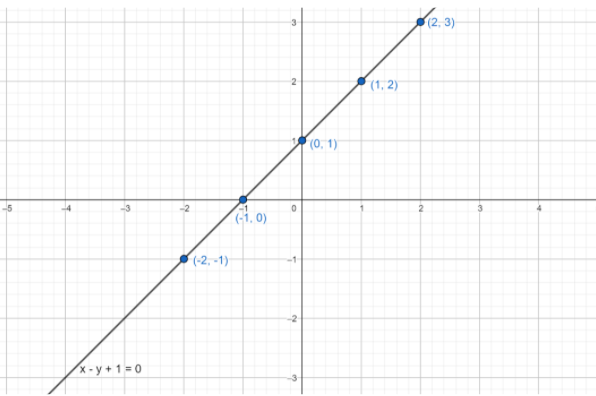
Consider the equation x−y+1=0 . Now the value of y from the above equation is given by
y=x+1
In the above equation x is an independent variable and y dependent variable because the value of y depends on the values of x . Now we will assume the range of independent variable x as x∈[−2,2] , the values of y for x∈[−2,2] are given by
| x | −2 | −1 | 0 | 1 | 2 |
|---|---|---|---|---|---|
| y=x+1 | −2+1=−1 | −1+1=0 | 0+1=1 | 1+1=2 | 2+1=3 |
From the above table we can write the coordinates on the line x−y+1=0 are (−2,−1) , (−1,0) , (0,1) , (1,2) , (2,3) . Now plotting these points on the line x−y+1=0 in graph is shown below
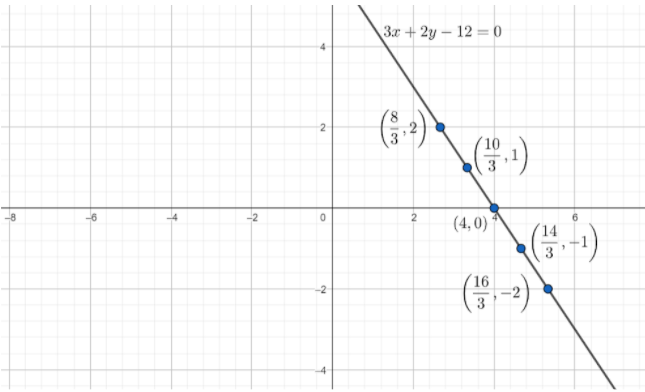
Consider the equation 3x+2y−12=0 . Now the value of x from the above equation is given by
x=312−2y
In the above equation y is an independent variable and x dependent variable because the value of x depends on the values of y . Now we will assume the range of independent variable y as y∈[−2,2] , the values of y for y∈[−2,2] are given by
| y | −2 | −1 | 0 | 1 | 2 |
|---|---|---|---|---|---|
| x=312−2y | 312−2(−2)=316 | 312−2(−1)=314 | 312−2(0)=312 | 312−2(1)=310 | 312−2(2)=38 |
From the above table we can write the coordinates on the line 3x+2y−12=0 are (316,−2) , (314,−1) , (4,0) , (310,1) , (38,2) . Now plotting these points on the line 3x+2y−12=0 in graph is shown below
Up to now drawing graphs of x−y+1=0 and 3x+2y−12=0 is completed. Now moving to next part i.e. Finding the coordinates of the triangle formed by these lines and x-axis. For this we need to draw both the graphs at one place or we will draw both graphs in one paper. Then the graph looks like below
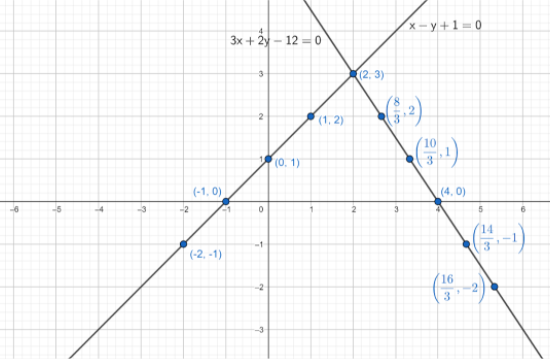
In the above graph we can observe that the lines have an intersect point say P . The intersect point P and the points (−1,0) , (4,0) are forming a triangle. Now the coordinates of the point P are calculated by solving the given two equations. For this we will substitute the value y=x+1 from equation x−y+1=0 in the other given equation 3x+2y−12=0 . Then we will have
3x+2y−12=0⇒3x+2(x+1)−12=0⇒3x+2x+2−12=0⇒5x=10⇒x=2
Now the value of y from y=x+1 is
y=x+1⇒y=2+1⇒y=3
∴ The intersect point is (2,3) . Now the triangle formed by the points (2,3) , (−1,0) , (4,0) is shown below
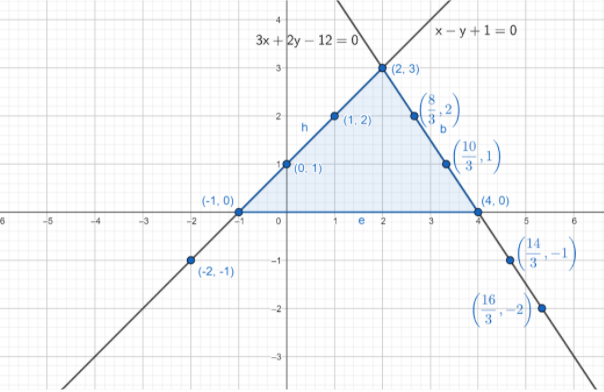
∴, Option – D is the correct answer.
Note: Students may make a lot of mistakes in this type of problem. The first and foremost is writing the coordinates of the points which lie on the line 3x+2y−12=0. For this line, we have taken the independent variable as y and the dependent variable as x so the table format is like y,x. But when we are writing the coordinates you should write the coordinates in (x,y) form only. The second one is the scale consideration while drawing the graphs. A better scale saves our time of drawing, so choose the proper scale according to the points we have.