Question
Question: Draw the graph of \[x + 5 = 0\]....
Draw the graph of x+5=0.
Solution
The given equation represents a straight line and is in the form of x=−k, and by the equation we can say that it is parallel to y-axis when the given equation is represented in a Cartesian plane, and by the equation it is clear that it passes through the point (−5,0), so the graph is straight line which is parallel to y-axis, and passes through the point (−5,0), that will be represented in the graph.
Complete step-by-step answer:
Given equation is x+5=0,
This can be rewritten as, x=−5,
Now firstly we will find the equation of the line that is parallel to the y-axis,
We know that the general form of equation of line will be,
y=mx+c,
And the slope of the line parallel to y-axis is equal to the slope of the y-axis which is equal to infinity, i.e.,01=∞,
Now substituting the slope value we get,
y=01⋅x+c,
Now taking c to other side we get,
y−c=01⋅x,
Now cross multiplying we get,
(0)y−c=x
So, the equation of the line parallel to y-axis will be x=0,
Now the general equation of line parallel to y-axis will become x=k, where k is constant as 0 is also a constant.
So from the above derivation, the given equation x=−5 is a line parallel to y-axis, and also we know that the line passed through the point (−5,0),
Now representing the above equation on then graph we get,
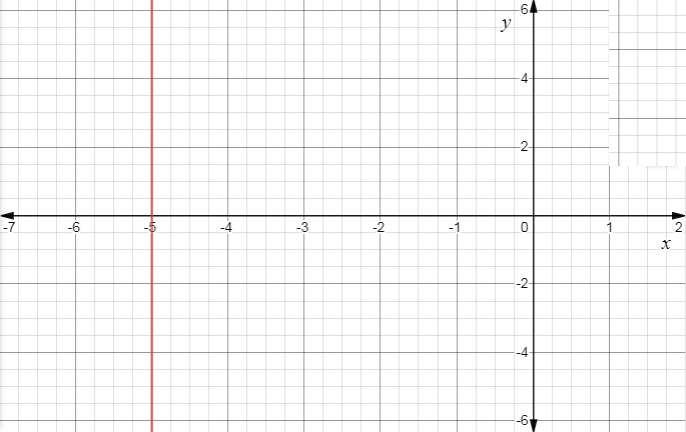
From the graph we can see that the line is parallel to y-axis and it passes through the point (−5,0).
Note:
In these type of questions, that shows that line is parallel to x-axis and y-axis we must use slope intercept formula i.e., y=mx+c, where m is the slope and c is the y-intercept of the line, and the graphs are usually represented on a Cartesian plane.