Question
Question: Draw the graph of the polynomial \(f\left( x \right) = - 3{x^2} + 2x - 1\)....
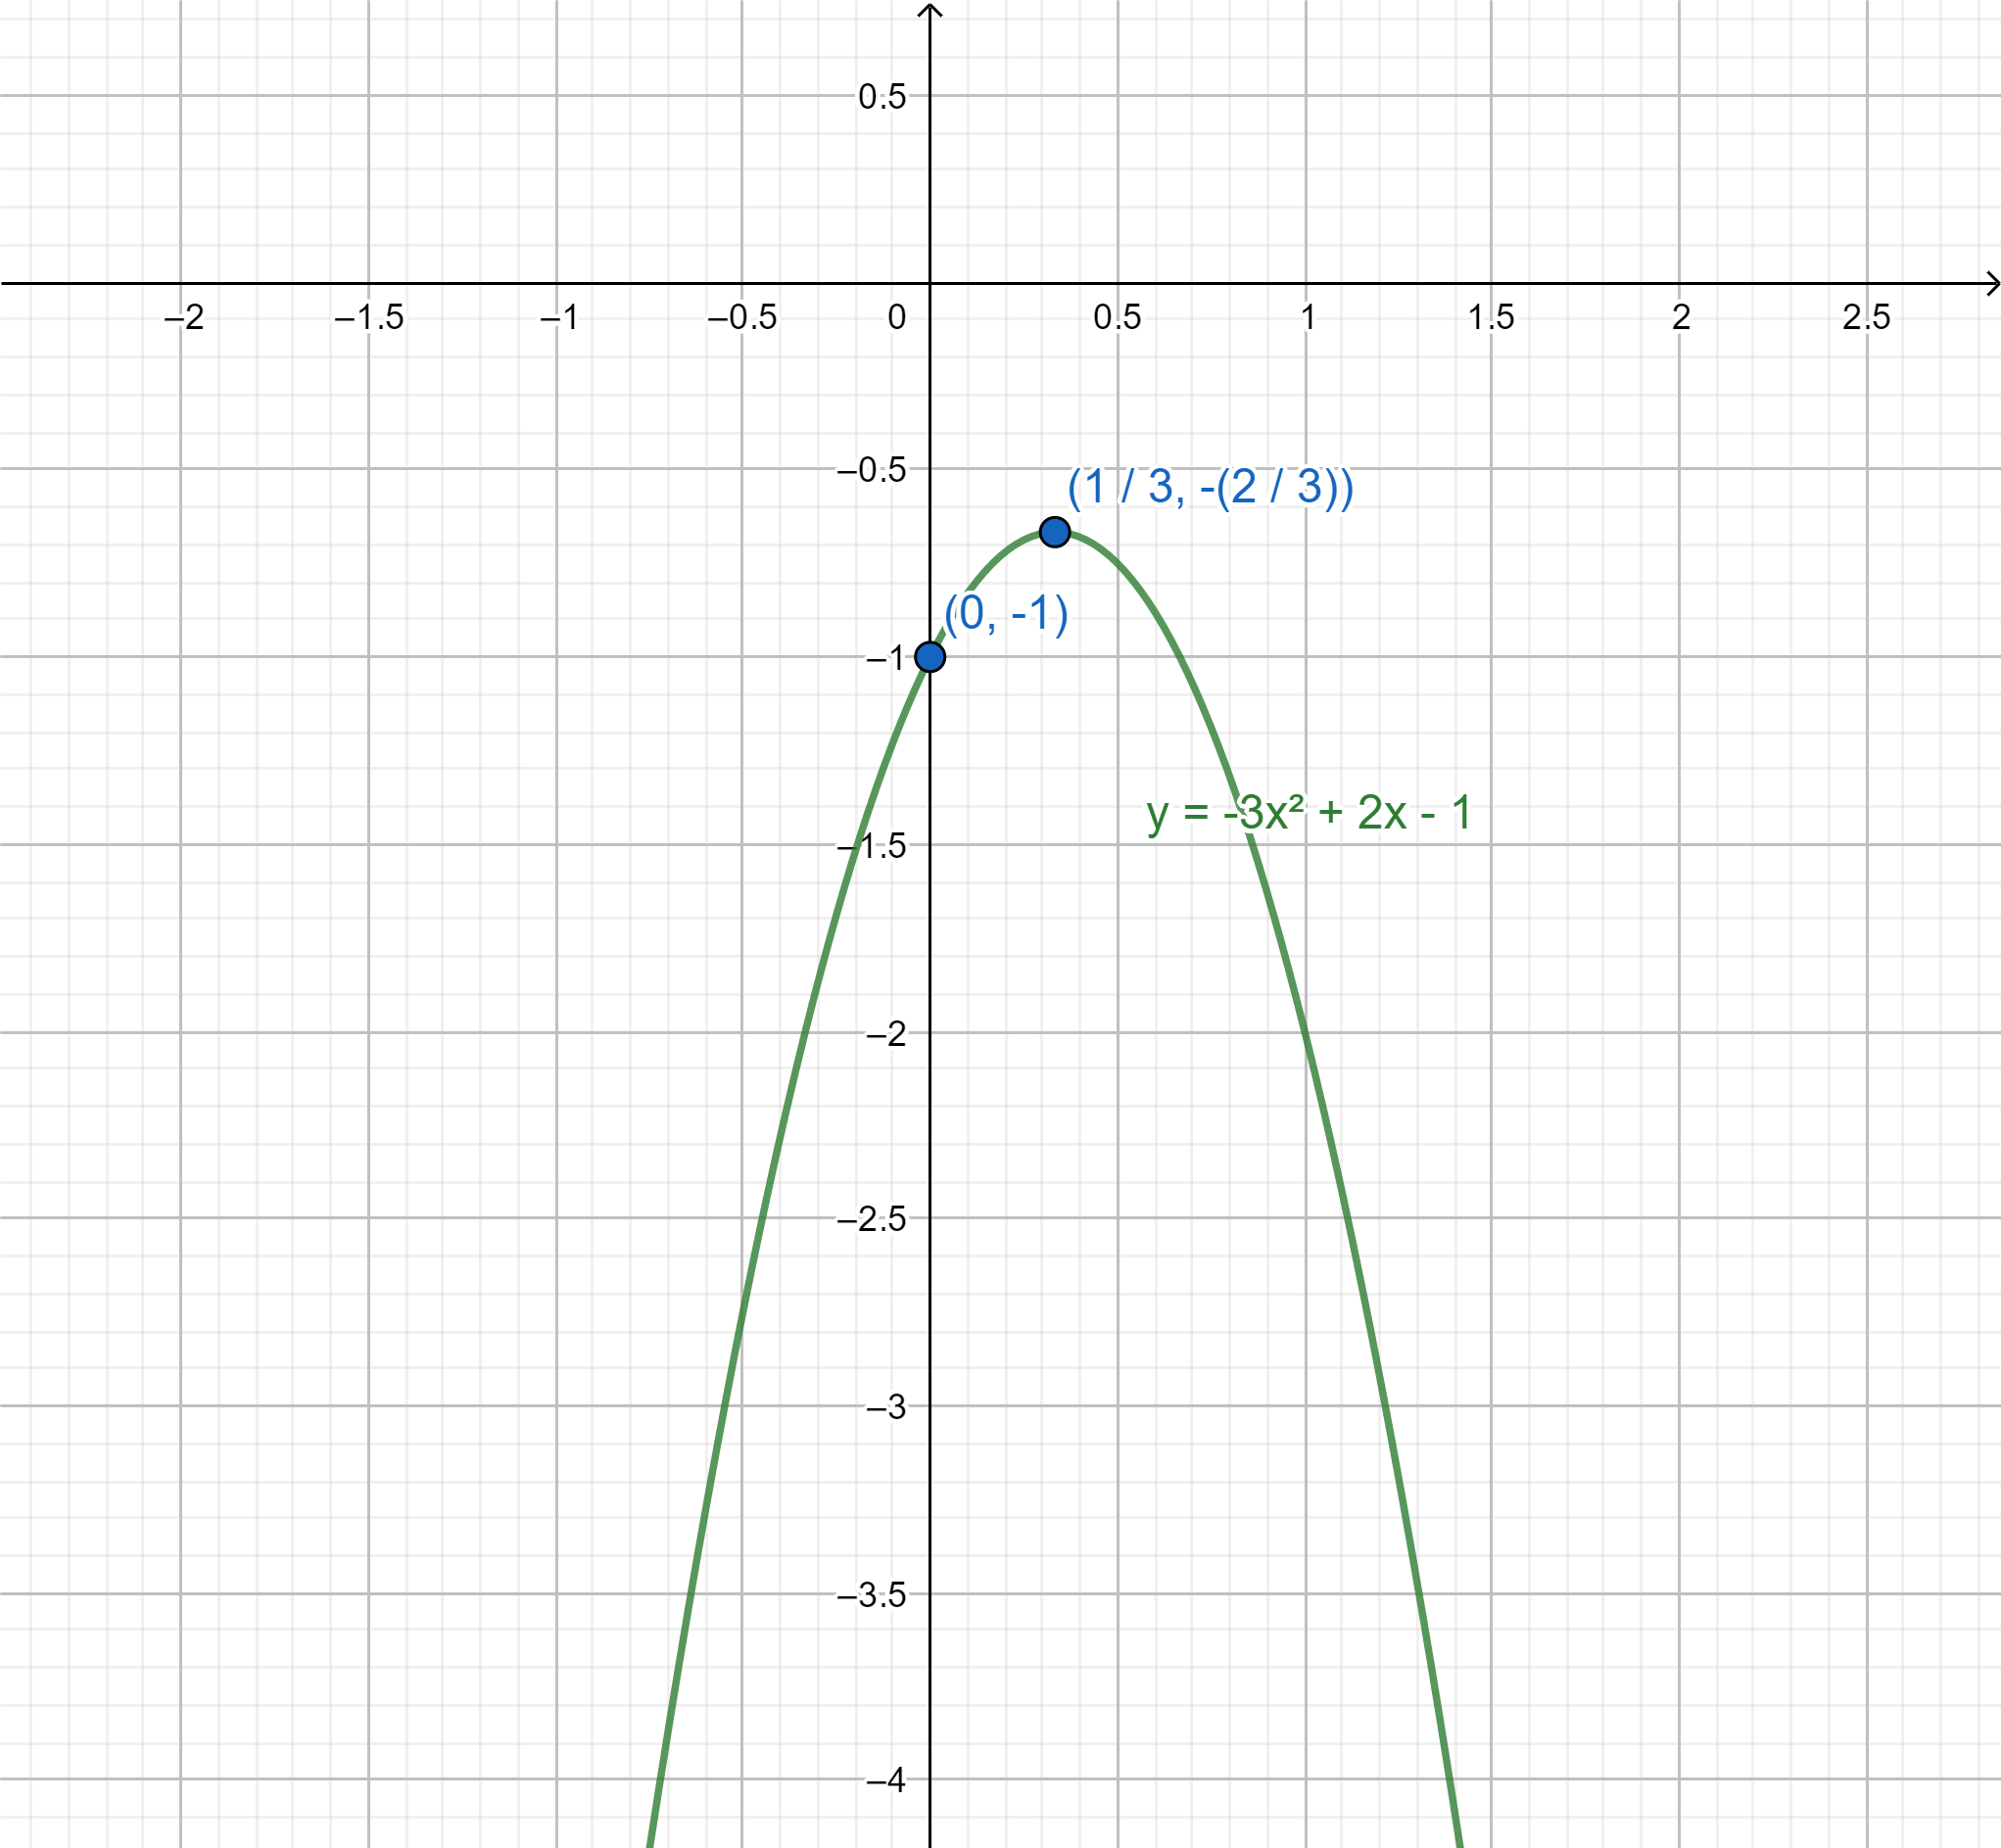
Draw the graph of the polynomial f(x)=−3x2+2x−1.
Solution
To draw a graph we can find the points at which the graph meets the X and Y-axis. For that, we can substitute the values of y and x in the function and solve the resulting equation. Then we can take the 1st derivative and equate it to zero to get the points of inflection. Then we can find the range of the function. Then we can plot the points of inflections and the X and Y intercepts and join these to get the required graph.
Complete step by step answer:
We have the function f(x)=−3x2+2x−1
We know that solution of an equation is the points where the graph of the function meets the x-axis.
To solve the polynomial, we need to equate it to zero.
⇒−3x2+2x−1=0
We can check the discriminant of the equation.
For an equation of the form ax2+bx+c=0 , discriminant is given by D=b2−4ac .
By substituting the values, we get,
⇒D=22−4×−3×−1
On simplification, we get,
⇒D=4−12
⇒D=−8
As the discriminant is less than 0, there is no solution to this equation. So the graph doesn’t intersect the X-axis.
To find the Y-intercept, we give the point (0,y) which represents any point on the Y-axis to the function and find the value of Y.
⇒−3×0+2×0−1=y
On simplification, we get,
⇒y=−1
So the Y intercept is (0,−1)
Now we can find the point of inflection. For that, we can find the 1st derivative of the function.
⇒f′(x)=−3×2x+2
⇒f′(x)=−6x+2
We know that at point of intersection, f′(x)=0
⇒−6x+2=0
On simplification, we get,
⇒−6x=−2
⇒x=31.
The value of the function at x=31 is given by,
f(31)=−3(31)2+2(31)−1
On simplification, we get,
f(31)=−31+2(31)−1
On taking LCM we get,
⇒f(31)=3−1+2−3
On simplification we get,
⇒f(31)=3−2
Therefore, the point of inflection is (3−2,31)
From the function, we can see that as x tends to infinity, the value of the function tends to negative infinity as coefficient of x2 is always negative.
As x tends to negative infinity also, y tends to infinity.
Now we can plot the Y intercept (0,−1) and point of inflection (3−2,31). Then we can join these and extend the curve towards negative infinity.
The graph is given by

Note: This method of drawing graph of the function can be used for any continuous function. While finding the X and Y-intercept, we need not get a solution if the graph doesn’t intersect the axes. Some functions may not have a point of inflection. In this problem, the interval we need to draw the graph is not mentioned. So, we took negative infinity to positive infinity as the interval. If the intervals are given, we must find the value of the functions at the endpoint or the limit if the interval is open. In this problem, we must check how the graph behaves as x tends to both negative and positive infinity.
