Question
Question: Draw the graph of the linear equation \(4x + y = 6\) . At what points the graph of the equation cuts...
Draw the graph of the linear equation 4x+y=6 . At what points the graph of the equation cuts the x axis and the y axis? Find the area bounded by this line and coordinate axes.
Solution
We need to draw the graph of the equation. For drawing a graph, we need a minimum of two points. After drawing a graph, we can just substitute 0 in x and y which will give us the points where it cuts both the axes. To find the area, we will use integration or just find the area by using the formula of area of triangles.
Complete step by step answer:
The given equation is: 4x+y=6
Let us find two points to draw the graph.
If we take the value of x to be zero,
4(0)+y=6
⇒y=6
If we take the value of y to be zero, we get:
4x+0=6
⇒x=23
Hence, our two points are: (0,6) and (23,0)
Now, using the two points, we will draw the graph.
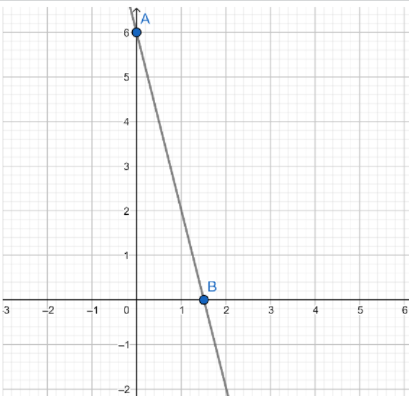
Where A is (0,6) and B is (23,0). We know that the points where this line cuts the graph is: (0,6) and (23,0). To find the area bounded by the coordinate axes, we will find the area of the triangle.
It is a right angle triangle with height = 6 and base = 23 .
We can use the area of triangle formula: 21bh
After substituting the values of base and height, we get:
21×(6)×(23)=4.5
Hence, the area bounded by the coordinate axes is 4.5 square units.
Note: We need to remember that to draw the graph of a linear equation, we need two points. Joining the two points we will get the graph. To find the area we can also use integration but it will complicate the question unnecessarily. Instead, we can try dividing the region into simple figures (polygons), and summation of all the areas will get the answer. One should avoid any sort of calculation mistakes while finding the area.