Question
Question: Draw the graph of the linear equation 3x+4y=6 . At what points , the graph cuts the x – axis and the...
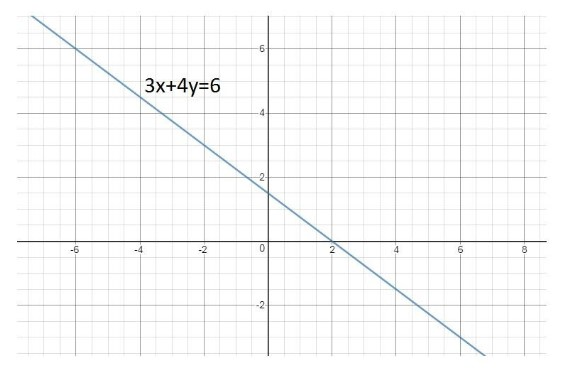
Draw the graph of the linear equation 3x+4y=6 . At what points , the graph cuts the x – axis and the y – axis .
A. The graph cuts the x-axis at (2,0) and the y-axis (0,23)
B. The graph cuts the x-axis at (3,0) and the y-axis (0,21)
C. The graph cuts the x-axis at (9,0) and the y-axis (0,25)
D. The graph cuts the x-axis at (5,0) and the y-axis (0,27)
Solution
Hint- In this particular type of question we need to plot the graph by assuming the value of x and finding the value of y we get required points and then observe the points where the line cuts the x axis and y axis . We can also do this by putting x = 0 and y = 0 simultaneously .
Complete step-by-step answer:
Graph of equation 3x+4y=6 is given as
In 3x+4y=6
Putting x=0
We get ,
4y=6
y=46=23
Putting y=0 ,
x = 36=2
The graph cuts the x-axis at (2,0) and the y-axis (0,23)
Therefore option A is correct .
Note-
In this particular type of question , the answer could be observed from the graph alone . You should recall the process of plotting and reading a graph to solve such kinds of questions . Note that we need two points to draw a line and those two points could be taken by putting x = 0 and y = 0 simultaneously .