Question
Question: Draw the graph of the equation \( 2x + y = 6 \) . Shade the region bounded by the graph and the coor...
Draw the graph of the equation 2x+y=6 . Shade the region bounded by the graph and the coordinate axis, also find the area.
Solution
Hint : To obtain a graph of a linear equation, we first assume some points of either variable(x or y) and then calculate the value of another variable using a given linear equation and then plot these points in x y plane on joining them we will get a graph of a linear equation. Then, find the coordinate of vertices of the triangle formed by a graph of a line and coordinate axis and hence it’s required area.
Complete step-by-step answer :
Given, linear equation is: 2x+y=6
To plot a graph of a linear equation. We first assume some points of either of the variables and then calculate the value of another variable using the given linear equation.
Let x=1, substituting it in a given linear equation. We have,
2(1)+y=6 ⇒2+y=6 ⇒y=6−2 ⇒y=4
Therefore for x=1, we have y = 4 .
Let x=2, substituting it in a given linear equation. We have,
2(2)+y=6 ⇒4+y=6 ⇒y=6−4 ⇒y=2
Therefore for x=2, we have y = 2 .
Let x=3, substituting it in a given linear equation. We have,
2(3)+y=6 ⇒6+y=6 ⇒y=6−6 ⇒y=0
Therefore for x=3, we have y = 0 .
Hence, from above we have a table:
| x | 1 | 2 | 3 |
|---|---|---|---|
| y | 4 | 2 | 0 |
Now, we will plot these points in the xy plane to find a graph of an equation 2x+y=6 .
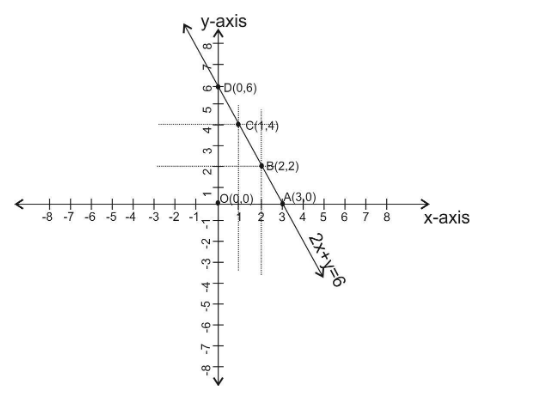
From the above graph we see that the graph of the linear equation meets the x-axis at (3,0) and y-axis at (0,6) .
Hence, coordinates of triangle OAB formed by graph of line and coordinate axis are given as:
O(0,0),A(3,0)andD(0,6) .
Therefore, area of triangle OAB = 21×OA×OD
⇒ar(ΔOAD)=21×3×6 ⇒ar(ΔOAD)=9
Hence, the area of the triangle formed by a graph of a line and coordinate axis is 9squareunit.
Note : While plotting a graph of any equation. First calculate points very carefully. If all calculated points on plotting a graph do not come on a straight line then it is a hint of mistake. As for linear equations, graphs are always a straight line.