Question
Question: Draw the graph of \( p\left( x \right) = {x^2} + 3x - 4 \) and find zeroes. Verify the zeroes of the...
Draw the graph of p(x)=x2+3x−4 and find zeroes. Verify the zeroes of the polynomials.
Solution
Hint : : For this type of problem we first convert given equation into standard form of parabola and then comparing with standard equation we get different characteristics of given parabola and using it we draw it on x-y plane and then using this graph, we can find different zeros of parabola.
Complete step-by-step answer :
We have p(x)=x2+3x−4
To draw a graph of a given equation. We take p(x) as y.
Therefore, we have
y=x2+3x−4
Clearly above equation is a second order equation in which one variable having square and other is linear.
Therefore, we can say that the graph of the equation will be a parabola.
But, to find its graph we first have to convert the given equation of parabola to the standard equation of parabola.
Steps for converting non-standard equation of parabola to standard equation of parabolas are as follows:
In the first step we shift variable term having square on one side and rest of term on other side of the equation.
⇒y+4=x2+3x
Now, using the completing square method to write quadratic as a perfect square.
Or
(x+23)2=(y+425)
Taking x+23=Xandy+425=Y . Above equation becomes.
X2=Y
Which is a standard equation of a parabola.
On comparing it with X2=4aY we have a=41 and parabola is upward parabolas with vertex is at (−23,−425) .
Plotting parabola with vertex (−23,−425) on x y plane as shown below:
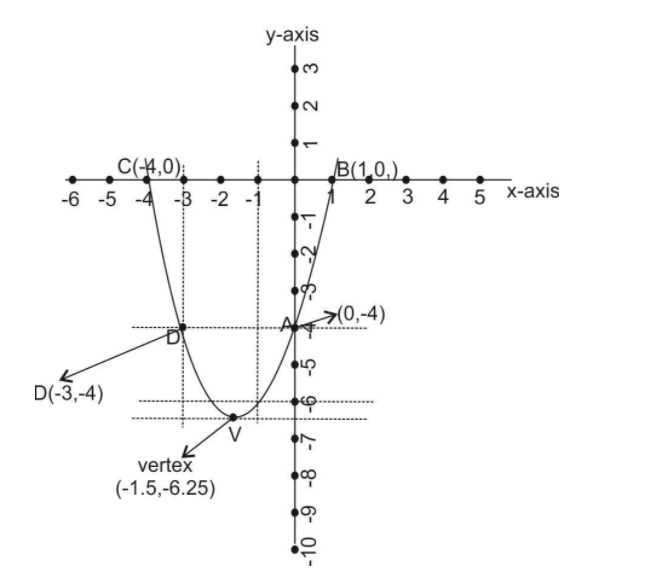
From above graph different zeros of parabolas are:
A(0,−4),B(1,0),C(−4,0)andD(−3,−4) .
To verify zeroes obtained above. We substitute in the given equation y=x2+3x−4 . Which is as follows:
For A(0,−4)
\-4=(0)2−3(0)−4 ⇒−4=−4
For, (1,0)
0=(1)2+3(1)−4 ⇒0=1+3−4 ⇒0=0
For, (−4,0)
0=(−4)2+3(−4)−4 ⇒0=16−12−4 ⇒0=16−16 ⇒0=0
And For, (−3,−4)
\-4=(−3)2+3(−3)−4 ⇒−4=9−9−4 ⇒−4=−4
Hence, from above we see that all points obtained from the graph also satisfy the equation. Hence, they all are zeros of the parabola.
Note : Graph of any curve can also be drawn by letting value of either variable and then getting value of other variable by substituting value in given equation and after that plotting all different points on x y plane and then joining all points to have graph of given equation. Also all those points taken are known as zeroes of the curve.