Question
Question: Draw the graph of an inverse trigonometric function?...
Draw the graph of an inverse trigonometric function?
Solution
Given an inverse trig function. We have to plot the inverse trigonometric function such as arcsine, arccosine, arctangent etc. functions. The graph of inverse trig function is plotted by switching the values of x and y variables. Also, the graph of the inverse trig function is symmetrical around the line with equation y=x.
Complete step by step answer:
First we will plot the graph of the trigonometric function y=sinx by finding the value of yfor different values of x.
For x=−2π, find the value of y.
⇒y=sin(−2π)
Apply the identity sin(−x)=−sinx to the expression.
⇒y=−sin(2π)
Substitute the value of sin(2π)=1 into the expression.
⇒y=−1
For x=0, find the value of y.
⇒y=sin0
Substitute the value of sin0=0 into the expression.
⇒y=0
For x=2π, find the value of y.
⇒y=sin(2π)
Substitute the value of sin(2π)=1 into the expression.
⇒y=1
Now, write the values of y for different values of x in tabular form.
| x | −2π | 0 | 2π |
|---|---|---|---|
| y | −1 | 0 | 1 |
Now, draw the graph of y=sinx by plotting the coordinates (x,y) on the set of x and y axis and join them.
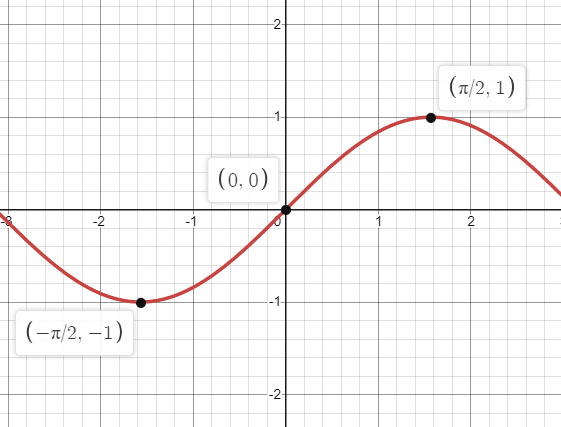
Now, compute the value of (x,y) for the graph of inverse trig function y=sin−1x by switching the values of x and y.
| x | −1 | 0 | 1 |
|---|---|---|---|
| y | −2π | 0 | 2π |
Now, draw the graph of y=sin−1x by plotting the coordinates (x,y) on the set of x and y axis and join them
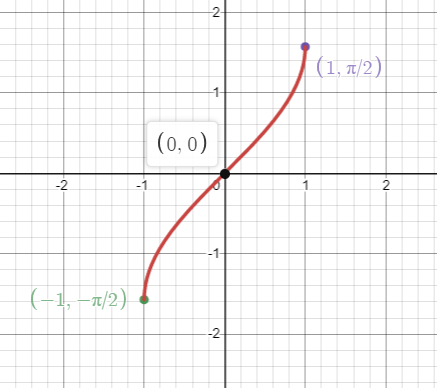
Note: In such types of questions students mainly do mistakes while plotting the points on the set of axes. In an ordered pair (x,y), the value of x is the distance of the point from y-axis whereas the value of y is plotted by taking the distance from the x-axis. In such types of questions, the graph of function is obtained by plotting these points.