Question
Question: Draw the graph for the linear equation: \(x=-2y\). A.The line passes through \(\left( 0,0 \right)\...
Draw the graph for the linear equation: x=−2y.
A.The line passes through (0,0) and m=21.
B. the line passes through (0,−2) and m=−21.
C. The line passes through (0,0) and m=−21.
D. the line passes through (−2,0) and m=−21.
Solution
Hint : Change of form of the given equation will give the x-intercept and y-intercept of the line x=−2y. We change it to the form of px+qy=1 to find the x intercept, and y intercept of the line as p and q respectively. Then we place the points on the axes and from there we draw the line on the graph.
Complete step-by-step answer :
We are taking the general equation of line to understand the slope and the intercept form of the line x=−2y. The given equation is in the form of y=mx+k. m is the slope of the line. The slope of the line is 5.
x=−2y⇒y=−21x
The value of m is m=−21.
We have to find the x-intercept, and y-intercept of the line x=−2y.
We find the points which go through the line and satisfy the equation x=−2y.
We can see that (0,0), (2,−1), (−4,2) satisfies the equation x=−2y.
We now draw the line on the graph.
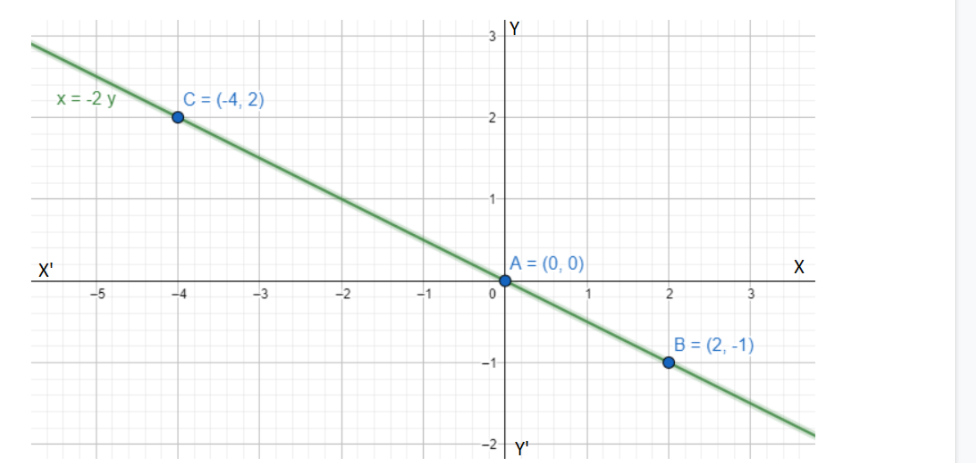
So, the correct answer is “Option C”.
Note : A line parallel to the X-axis does not intersect the X-axis at any finite distance. Hence, we cannot get any finite x-intercept of such a line. Same goes for lines parallel to the Y-axis. In case of slope of a line the range of the slope is 0 to ∞.