Question
Question: Draw the graph between the area of the circle versus its radius....
Draw the graph between the area of the circle versus its radius.
Solution
A circle is a curve or a shape which is formed by plotting all the points on a plane that are located at equal distances from a fixed point. Write down the formula for the area enclosed by a circle and compare it with the known functions and plot the graph.
Complete step by step answer:
Let us first understand what is a circle. A circle is a curve or a shape which is formed by plotting all the points on a plane that are located at equal distances from a fixed point.You draw a circle on a plane paper by using a compass and a pencil, by fixing the pointed end of the compass at a point and the rotating the pencil to make a complete angle. The distance between the tip of the compass and the tip of the compass is the radius of the circle.
Since circle is a closed figure, it encloses some area within itself. The area enclosed by a circle is given as A=πr2, where r is the radius of the circle.Let us analyse the equation for the area of a circle, i.e. A=πr2.We can see that area A is directly proportional to the square of the radius (r), since π is a constant.We can compare this equation to the equation of a vertical parabola, y=ax2, plotted on a Cartesian plane. In this case, y=A , x=r and a=π.Therefore, the graph of area of circle versus its radius is parabola and the graph will look like:
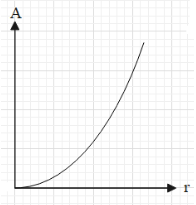
Note: Note that the we should not plot the parabola for the negative x-axis as radius of a circle is always a positive quantity.From the figure and also the equation, we can understand that the area of a circle increases if we increase the radius of the circle.We can think about this even without the formula as we know that if we increase the radius of a circle, the size of the circle increases and thus the area of the circle increases.