Question
Question: Draw the energy level diagram for the line spectra representing Lyman Series and Balmer series in th...
Draw the energy level diagram for the line spectra representing Lyman Series and Balmer series in the spectrum of Hydrogen atoms.
Solution
When an electron makes a transition from one orbit to the other in an atom, it gains or loses energy due to which it emits wavelengths corresponding to the energy differences. These wavelengths are observed as lines called spectral lines. Different wavelengths are emitted for different transitions.
Formulas Used:
λ1=RH(n121−n221)
Complete answer:
In a hydrogen atom, when an electron moves from one orbit to the other, it emits rays of different wavelengths. The array of different wavelengths emitted is called the emission spectrum of hydrogen. These emissions are divided into a number of spectral series with wavelengths given by the Rydberg Formula. These series are observed as lines when electrons make transitions from one energy level to the other.
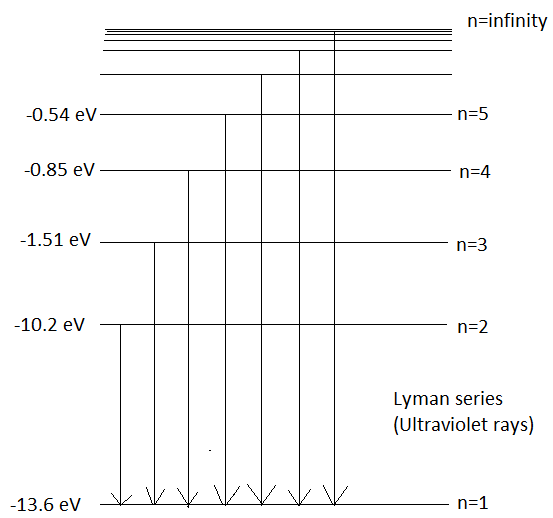
When an electron makes a transition to orbit, n=1 from higher energy levels then the series of emission lines observed is called Lyman Series. It emits wavelengths in the ultraviolet region. Its wavelength can be given by Rydberg’s Formula which is,
λ1=RH(n121−n221) - (1)
Here, λ is the wavelength emitted
RH is the Rydberg’s constant, its value is 1.09×10⁷m−1
Substituting the values of n1=1andn2=2 in eq (1) we get,