Question
Question: Draw a rough sketch of the graph of the function \[y = {x^2}\]?...
Draw a rough sketch of the graph of the function y=x2?
Solution
We need to draw the graph ‘x’ versus ‘y’. We give the random values for ‘x’ and we find the value of ‘y’. We can give all real numbers for the value of ‘x’. Thus we will have coordinate points (x, y). Hence, we can plot the graph by using the values. We can also draw the graph using the intercept method. But here we have a function which is passing through origin. So we use tables to draw the graph.
Complete step by step answer:
Given y=x2.
Let's give the values for ‘x’ and we find the value of ‘y’.
Put x=1in y=x2 we have,
y=(1)2=1
Thus we have coordinate points (1,1).
Put x=−1in y=x2 we have,
y=(−1)2=1
Thus we have coordinate points (−1,1).
Put x=2in y=x2 we have,
y=(2)2=4
Thus we have coordinate points (2,4).
Put x=−2in y=x2 we have,
y=(−2)2=4
Thus we have coordinate point (−2,4).
Put x=3in y=x2 we have,
y=(3)2=9
Thus we have coordinate point (3,9).
Put x=−3in y=x2 we have,
y=(−3)2=9
Thus we have coordinate point (−3,9).
Put x=4in y=x2 we have,
y=(4)2=16
Thus we have coordinate point (4,16).
Put x=−4in y=x2 we have,
y=(−4)2=16
Thus we have coordinate point (−4,16).
Thus we have,
| x | 1 | −1 | 2 | −2 | 3 | −3 | 4 | −4 |
|---|---|---|---|---|---|---|---|---|
| y | 1 | 1 | 4 | 4 | 9 | 9 | 16 | 16 |
Let’s draw the graph for these coordinates,
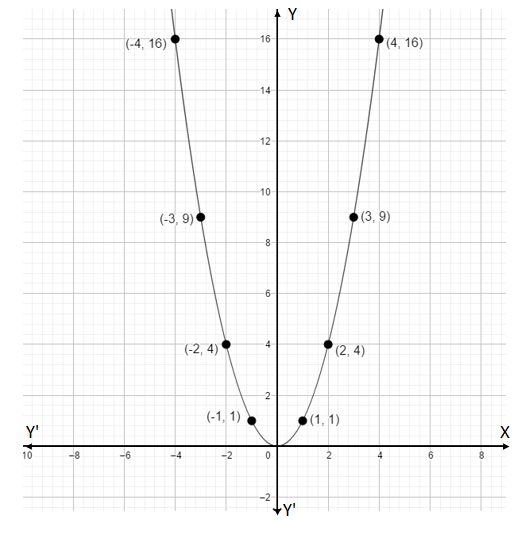
Note: We can see that the given curve is parabola. A graph shows the relation between two variable quantities, it contains two axes perpendicular to each other namely the x-axis and the y-axis. Each variable is measured along one of the axes. In the question, we are given one linear equation containing two variables namely x and y, x is measured along the x-axis and y is measured along the y-axis while tracing the given equations.