Question
Question: Draw a plot showing the variation of (i) inductive reactance and (ii) capacitive reactance with the ...
Draw a plot showing the variation of (i) inductive reactance and (ii) capacitive reactance with the frequency of Ac source.
Solution
When a capacitor or inductor gets connected with an AC source, due to change in the input AC voltages, capacitor and inductor develops a reactance. This reactance of capacitor and inductor will be dependent on frequency of AC source. If you take a resistance value of a resistor real, resistance of capacitors or inductors are purely imaginary.
Complete step by step answer:
We are assuming that voltage of the source is V=V0sinωt, where V0is amplitude of the voltage and ω=2πf is angular frequency and f is frequency of the AC source. Now for a pure capacitor with capacitance C, have impedance
Z=j/ω
C=j/2πfC, where j2=−1 ,
which means it is purely imaginary. And for a pure inductor with inductance L, have impedance Z=jω
L =j2πfL which also means it is purely imaginary. We can represent it as amplitude with a phase. The reactance is the amplitude part of the impedance for both cases.
Now, if we plot both inductor reactance and capacitor reactance with respect to frequency of AC voltage source, we will get,
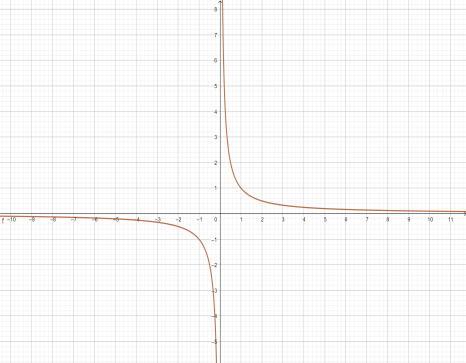
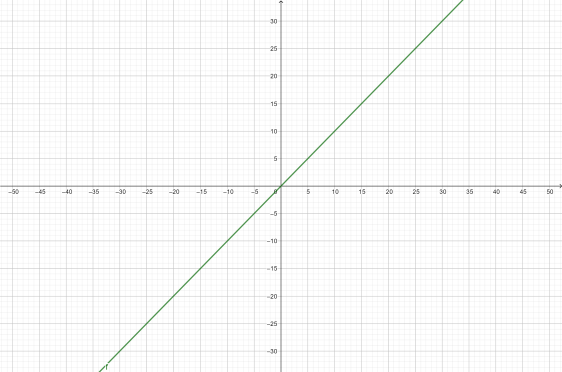
Fig-1: Capacitor reactance Fig-2: Inductor reactance
For the case of capacitor and inductor reactance, the slope of the curve is constant.
Note:
The current of the system will always be lagging to its voltage because of the phase of capacitor reactance and will always be leading to its voltage because of the inductor reactance. The phase difference will be2Πin both cases. In most of the circuit with real resistors, the power will dissipate by heat energy. In some cases, it may be as radiation energy.