Question
Question: Draw a plot showing the variation of (i) electric field (E) and (ii) electric potential (V) with dis...
Draw a plot showing the variation of (i) electric field (E) and (ii) electric potential (V) with distance r due to a point charge Q.
Solution
Electric potential is inversely proportional to the distance and electric field is inversely proportional to square of distance. Since the field and potential are inversely proportional we need to draw graph which is similar to some inverse graph such as y=x1 types and y=x21.
Complete step by step solution: Electric field definition: Electric field is the electric force per unit charge. The direction of the force it would exert on a positive test charge is the same as the direction of the field. The direction of the electric field is radially outward from a positive charge and radially inwards towards a negative point charge.
Electric potential is also known as electric field potential or potential drop. It is described as the amount of work done to move a unit of electric charge from a reference point to a specific point in an electric field without producing an acceleration.
The formula for electric field is:
E=r2kQ
Where E is the electric field
Q is the point charge
k is a constant with value 8.99×10⁹Nm2/C2
r is the distance from the point charge
The formula for electric potential is:
V=rkQ
Where V is the electric potential
It is clear from the formula that the only variable is the distance since the value of k is constant and the charge will also be constant. Therefore the graph of electric field will be similar to y=x21 and graph of electric potential will be similar to y=x1 .
Thus, the required graph is:
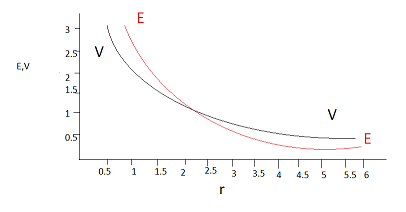
Note: The value of k=4πε01 and it is dimensionless. Point charge does not occupy any area nor does it have any volume. There is a relation between electric field and electric potential, the electric field is the gradient of potential in the positive X direction.