Question
Question: Draw a pie chart for the following data. Team of expenditure| Amount spent ---|--- Food| \(3...
Draw a pie chart for the following data.
| Team of expenditure | Amount spent |
|---|---|
| Food | 3750 |
| Health | 1875 |
| Clothing | 1875 |
| Education | 1200 |
| Saving | 7500 |
Solution
According to the question given in the question we have to determine the pie chart for the amount spent in food, health, clothing, education, and saving which are 3750,1875,1875,1200 and 7500. So, first of all we have to understand about the pie chart which is as explained below:
Pie chart: A pie chart is circular in shape and is a circular statistical graphic, which is divided into slices to illustrate numerical portions and in a pie chart the arc length of each slice which is its consequently its central angle and area is proportional to the quantity represented. While it is named for its resemblance to a pie which has been sliced, there are various ways it can be presented.
Now, we have to draw the pie chart as explained above, for the given data table.
To obtain the pie chart first of all we have to determine the total amount spent which can be just adding all of the given amounts.
Now, we have to determine the central angle for the pie chart which can be determined by dividing the given amounts by the sum of total amount and then we have to multiply it with the angle 3600
Complete step-by-step solution:
Step 1: First of all we have to determine the sum of all the amounts which are 3750,1875,1875,1200 and 7500 which are spent in food, health, clothing, education, and saving. Hence,
=3750+1875+1875+1200+7500 =16200
Step 2: Now, we have to determine the fraction in which we just have to divide the given cost for different causes with the sum of total amounts as obtained in the solution step 1. Hence,
| Team of expenditure | Amount spent | Fraction |
|---|---|---|
| Food | 3750 | 162003750=20825 |
| Health | 1875 | 162001875=21625 |
| Clothing | 1875 | 162001875=21625 |
| Education | 1200 | 162001200=272 |
| Saving | 7500 | 162007500=5425 |
Step 3: Now, we have to determine the central angle and for this we just have to multiply the obtained fraction with the angle 3600as mentioned in the solution hint.
| Team of expenditure | Amount spent | Fraction | Central angle |
|---|---|---|---|
| Food | 3750 | 162003750=20825 | 20825×3600=83.30 |
| Health | 1875 | 162001875=21625 | 21625×3600=41.70 |
| Clothing | 1875 | 162001875=21625 | 21625×3600=41.70 |
| Education | 1200 | 162001200=272 | 272×3600=26.70 |
| Saving | 7500 | 162007500=5425 | 5425×3600=166.60 |
Step 4: Now, as we have obtained the central angle so we just have to draw the pie chart for the data obtained just above which is as given below:
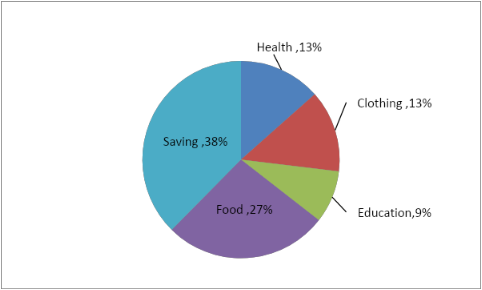
Note: To determine the central angle first of all we have to determine the fraction of the amount spent in different causes by the sum of total amount and after that we have to multiply the obtained faction with the fractions obtained.
A circular statistical graphic, which is divided into slices to illustrate numerical portions and in a pie chart the arc length of each slice which is its consequently its central angle and area is proportional to the quantity represented is a pie chart.