Question
Question: Draw a percentage bar graph for the following data: Divisions| A| B| C| D ---|---|---|---|-...
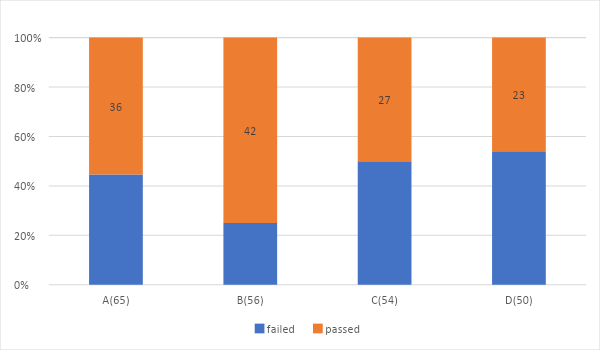
Draw a percentage bar graph for the following data:
| Divisions | A | B | C | D |
|---|---|---|---|---|
| Total strength | 65 | 56 | 54 | 50 |
| students passed in English | 36 | 42 | 27 | 23 |
Solution
We first determine the formula to find the percentage of students passed in English. We take given data as two variables and find the percentages. Then we place them in a percentage bar graph to find out the illustration.
Complete step by step answer:
We find the percentage formula for the students who passed in English.
We are taking two variables x and y. x being the number of students passed in English in a single division and y being the total strength in that same division.
So, there are four divisions named A, B, C, D.
We find the percentage theorem as yixi×100 where i=A,B,C,D.
For division A the percentage is 6536×100=55.38.
For division B the percentage is 5642×100=75.
For division C the percentage is 5427×100=50.
For division D the percentage is 5023×100=46.
Now we make a table to illustrate this
| Divisions | total strength(y) | students passed in English(x) | percentages (%) |
|---|---|---|---|
| A | 65 | 36 | 55.38 |
| B | 56 | 42 | 75 |
| C | 54 | 27 | 50 |
| D | 50 | 23 | 46 |
We place the data to find the percentage bar
Note:
Percentage bar graph is used to find the comparison. The data of a single variable should be put under a single bar. We can also relate it with the numbers of students failing the English examination.