Question
Question: Draw a Histogram for the following data : Class Interval| Frequency ---|--- 0 − 10| 35 ...
Draw a Histogram for the following data :
| Class Interval | Frequency |
|---|---|
| 0 − 10 | 35 |
| 10 − 20 | 70 |
| 20 − 30 | 20 |
| 30 − 40 | 40 |
| 40 − 50 | 50 |
Solution
To draw a histogram firstly we should observe the data given. In the above question here we have five class intervals as 0 − 10, 10 − 20, 20 − 30, 30 − 40 and 40 – 50 having the frequencies as 35, 70, 20, 40 and 50 respectively. Plot these data to obtain the Histogram.
Complete step-by-step answer:
Here we have the given data as follows,
| Class Interval | Frequency |
|---|---|
| 0 − 10 | 35 |
| 10 − 20 | 70 |
| 20 − 30 | 20 |
| 30 − 40 | 40 |
| 40 − 50 | 50 |
Now plot each of the class intervals given in the question in horizontal axis and their respective frequencies along with it in vertical axis. Here we have class intervals as 0 − 10, 10 − 20, 20 − 30, 30 − 40 and 40 – 50 having the frequencies as 35, 70, 20, 40 and 50 respectively.
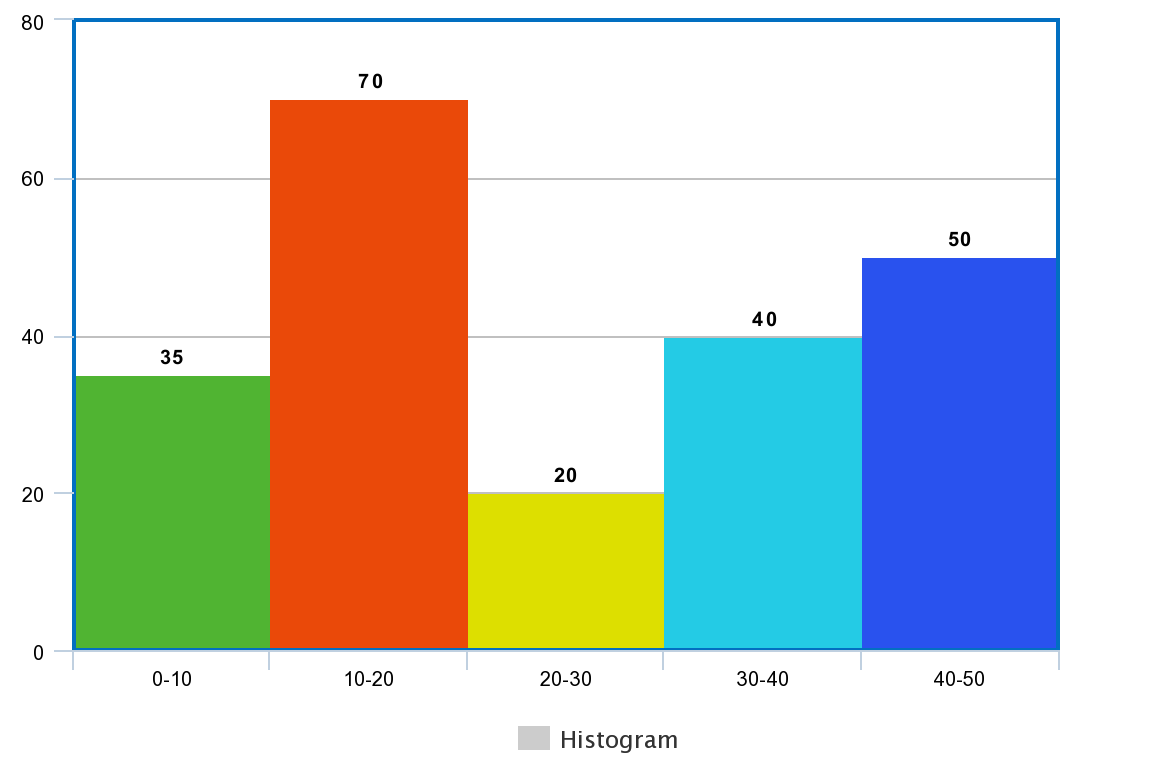
The plot shown above is the required histogram
Note: It is required for the student to have the knowledge of potting the data from the given information in the question to get the required histogram and the student should be aware of the rules and steps to be followed while plotting the histogram using the given data.