Question
Question: Draw a histogram for the adjacent data. Class interval| 0-9| 10-14| 15-24| 25-29| 30-34 ---...
Draw a histogram for the adjacent data.
| Class interval | 0-9 | 10-14 | 15-24 | 25-29 | 30-34 |
|---|---|---|---|---|---|
| Frequency | 6 | 4 | 12 | 10 | 8 |
Solution
We start solving the problem by checking whether the given data for the histogram is continuous or not. If the given data is continuous, we use that original data to draw the histogram otherwise we add the correction to the upper and lower boundaries of each class interval. We then draw the histogram after making corrections to the given data as mentioned above.
Complete step by step answer:
According to the problem, we need to draw the histogram for the given data as shown in the table below.
| Class interval | 0-9 | 10-14 | 15-24 | 25-29 | 30-34 |
|---|---|---|---|---|---|
| Frequency | 6 | 4 | 12 | 10 | 8 |
We can see that the upper boundary of the previous interval is not equal to the lower boundary of next interval which makes it not continuous. So, we need to add correction 0.5 to each upper boundary and subtract correction 0.5 to each lower boundary to make them continuous.
Now, let's rewrite the distribution table after making corrections.
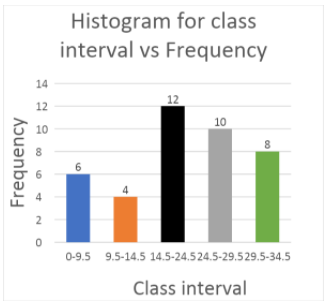
| Class interval | 0-9.5 | 9.5-14.5 | 14.5-24.5 | 24.5-29.5 | 29.5-34.5 |
|---|---|---|---|---|---|
| Frequency | 6 | 4 | 12 | 10 | 8 |
Here we have taken zero as there is no significance for the negative lower boundary of a class interval.
Now, let us draw a histogram for the obtained data as shown in the table.
Let us assume the scale for the histogram be as follows:
1 cm on y-axis = 2 units of frequency.
So, the required histogram is
Note:
We should confuse histogram with the bar graph as both look equivalent. We should note that the only difference between a bar graph and histogram is that there will be no gaps between bars in histogram whereas the bars in bar graphs have some gap between them. Histogram gives a better view for a given data than any many other graphs or charts. Similarly, we can expect problems to draw the bar graph and find the mean, median and mode for the given data.