Question
Question: Draw a frequency polygon of the following data: C| 10-19| 20-29| 30-39| 40-49| 50-59| 60-69| 70...
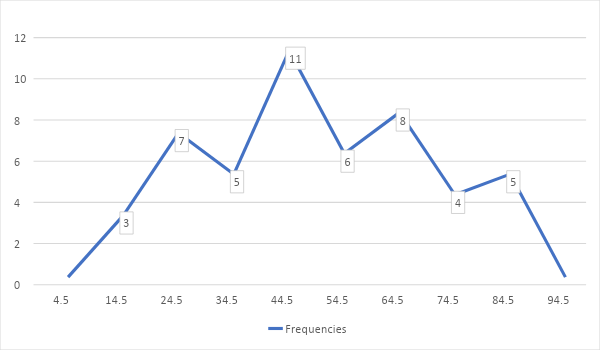
Draw a frequency polygon of the following data:
| C | 10-19 | 20-29 | 30-39 | 40-49 | 50-59 | 60-69 | 70-79 | 80-90 |
|---|---|---|---|---|---|---|---|---|
| f | 3 | 7 | 5 | 11 | 6 | 8 | 4 | 5 |
Solution
We first find the class intervals of equal width and the class marks for the given data series. We plot the class marks and the frequencies along the horizontal and vertical axes respectively to find the frequency polygon.
Complete step-by-step solution:
A frequency polygon is to exhibit the frequency distribution of a continuous variable. Two mutually perpendicular axes are taken for the class marks and the frequencies. They are plotted along the horizontal and vertical axes respectively.
We find the class intervals of equal width and the class marks for the given set of class limits of the continuous data.
| Class-limits | Class-intervals | Class-marks | Frequencies |
|---|---|---|---|
| 10-19 | 9.5-19.5 | 14.5 | 3 |
| 20-29 | 19.5-29.5 | 24.5 | 7 |
| 30-39 | 29.5-39.5 | 34.5 | 5 |
| 40-49 | 39.5-49.5 | 44.5 | 11 |
| 50-59 | 49.5-59.5 | 54.5 | 6 |
| 60-69 | 59.5-69.5 | 64.5 | 8 |
| 70-79 | 69.5-79.5 | 74.5 | 4 |
| 80-90 | 79.5-89.5 | 84.5 | 5 |
Now we draw the frequency polygon based on the frequencies and the class-marks. To get a closed polygon, we take two additional classes, one at each end which have zero frequencies.
Note: We have to be careful about the class intervals being of equal width. The changes of axes for different points are also allowed. So, we have to find the variables for the two series to place points.