Question
Question: Draw a frequency polygon for the following frequency distribution. Rainfall (in mm)| Class mark|...
Draw a frequency polygon for the following frequency distribution.
| Rainfall (in mm) | Class mark | Number of years |
|---|---|---|
| C.I. | xi | f |
| 15 – 20 | 17.5 | 0 |
| 20 – 25 | 22.5 | 2 |
| 25 – 30 | 27.5 | 5 |
| 30 – 35 | 32.5 | 8 |
| 35 – 40 | 37.5 | 12 |
Solution
Here, we need to draw the frequency polygon. A frequency polygon is a polygon whose area is the sum of all frequencies. We will use the class marks and frequencies to mark the points and join them to create the required frequency polygon.
Complete step by step solution:
We can construct a frequency polygon by first drawing a histogram to represent the given data. Then, joining the mid-points of the top of the rectangles in the histogram, we can construct the frequency polygon.
Since class marks are already given, we do not need to draw a histogram. We can construct the frequency polygon directly using the class marks and number of years.
Now, let us draw the frequency polygon step by step.
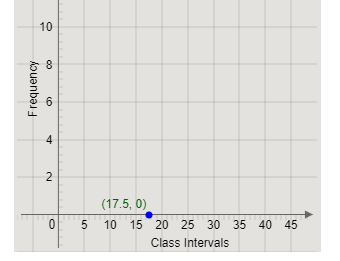
The first class interval is 15 – 20, with class mark 17.5 and frequency 0.
The class mark and frequency can be represented as the point (17.5,0) on the graph.
Marking the point on the graph, we get
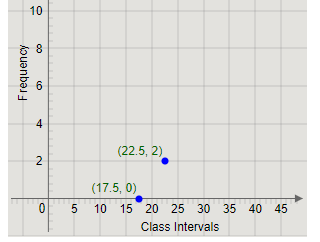
Next, the second class interval is 20 – 25, with class mark 22.5 and frequency 2.
The class mark and frequency can be represented as the point (22.5,2) on the graph.
Marking the point on the graph, we get
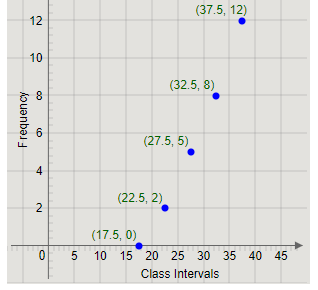
Similarly, we will mark the other points.
The class mark 27.5 and frequency 5 can be represented as the point (27.5,5) on the graph.
The class mark 32.5 and frequency 8 can be represented as the point (32.5,8) on the graph.
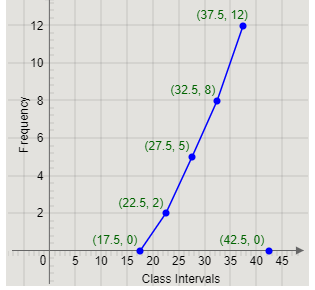
The class mark 37.5 and frequency 12 can be represented as the point (37.5,12) on the graph.
Therefore, the graph becomes
We will join pairs of points representing the class mark and frequency of two consecutive class intervals. For example, we will join (17.5,0) and (22.5,2), (22.5,2) and (27.5,5), etc.
Joining the points, we get the graph
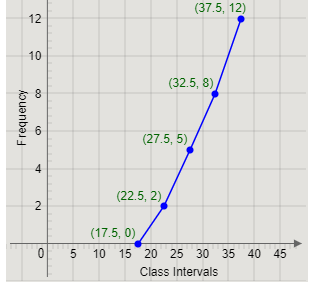
Now, we can observe that the figure obtained is not a closed figure.
A polygon is always a closed figure.
Therefore, we will add another class interval with the same class width and frequency 0.
Thus, we add the class interval 40 – 45, with class mark 42.5 and frequency 0.
The class mark 42.5 and frequency 0 can be represented as the point (42.5,0) on the graph.
Marking the point on the graph, we get
Finally, joining (37.5,12) and (42.5,0), we get
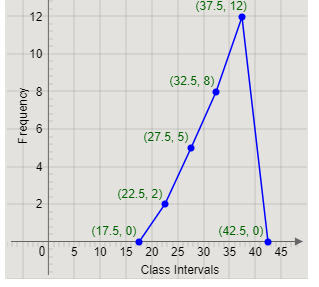
This is the required frequency polygon.
Note:
We used another class interval 40 – 45, with class mark 42.5 and frequency 0. The class marks of a class interval is the midpoint of the class interval. It is equal to the average of the upper limit and lower limit of the class interval. The class mark of a class interval can be calculated using the formula 2Lowerlimit+Upperlimit. Thus, the class mark of the class interval 40 – 45 is 240+45=285=42.5.
A common mistake is to leave the frequency polygon as
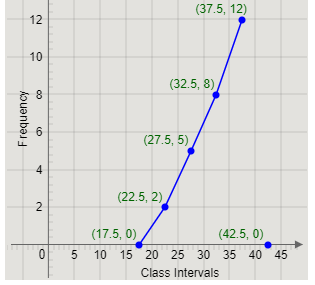
This is incorrect because a polygon needs to be a closed figure. Therefore, another interval 40 – 45 with frequency 0 is needed to complete the polygon.