Question
Question: Draw a diagram showing the temperature of various layers of water in an ice covered pond....
Draw a diagram showing the temperature of various layers of water in an ice covered pond.
Solution
In the above question they have mentioned that we have to draw the various layers of the water when an ice covered pond. When an ice is covered then the temperature changes from layer to layer. Let’s show the diagram in the solution part.
Complete step by step answer:
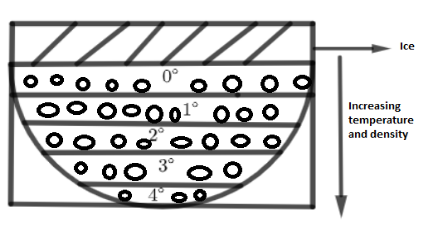
In the above diagram we have drawn, when an ice is covered by water then the temperature is slowly increasing from top to bottom as shown in the figure. The temperature when the water layer is near to the ice then the temperature is at 0∘. Above diagram clearly shows, when the water depth is increased then the temperature of the density of the water also goes on increasing. Temperature varies in layers in an ice covered pond.
Additional information:
At 4∘C the water slowly freezes where it expands approximately by 9%. At 4∘C the water is in solid state. When water at 3∘C the two temperatures either at 4∘C the density of the water is at maximum. So the density of water at 3∘C remains the same.
Note: In the above information we have drawn the diagram when an ice is covered by a water pond then the temperature varies in the layers of the pond. As it is increasing the temperature and density of the water then the water slowly transforms into solid state. As mentioned in the question we have drawn the diagram.