Question
Question: Draw a curve showing density or pressure variations with respect to distance for a disturbance produ...
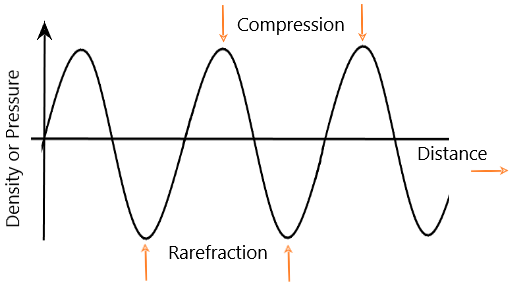
Draw a curve showing density or pressure variations with respect to distance for a disturbance produced by sound. Mark the position of compression and rarefaction on this curve. Also define wavelengths and time period using this curve.
Solution
We need to keep in mind the following definitions.
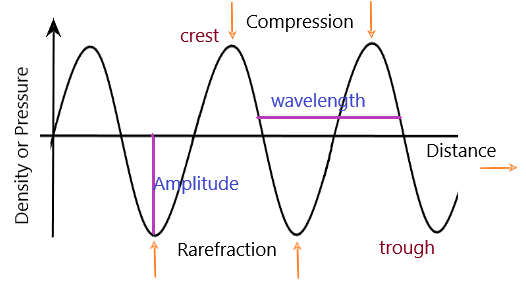
Wavelength is the distance between two consecutive points having the same phase.
Time period is the time taken for a complete oscillation.
Frequency is the inverse of time period. It is given by the number of complete oscillations per unit time.
Complete step by step answer:
Wavelength is the distance between any two consecutive points having the same phase,
It is a characteristic of both traveling and standing waves. Wavelength is generally denoted by λ.
The amplitude is the height of the curve, i.e. the maximum or minimum density or pressure attained by the wave.
Time period is the time taken for a complete oscillation. Frequency is the inverse of time period. It is given by the number of complete oscillations per unit time. The unit for frequency is Hertz (Hz) where the value of 1 Hz is equivalent to 1 cycle/second or cps.
The diagram below shows the density or pressure variations with respect to distance for a sound wave.
Note: Wavelength is the distance between any two consecutive points having the same phase,
It is a characteristic of both traveling and standing waves. Wavelength is generally denoted by λ.
The amplitude is the height of the curve, i.e. the maximum or minimum density or pressure attained by the wave.