Question
Data Interpretation & Logical Reasoning (DILR) Question on Data Interpretation
Directions: Answer the questions based on the information given below.
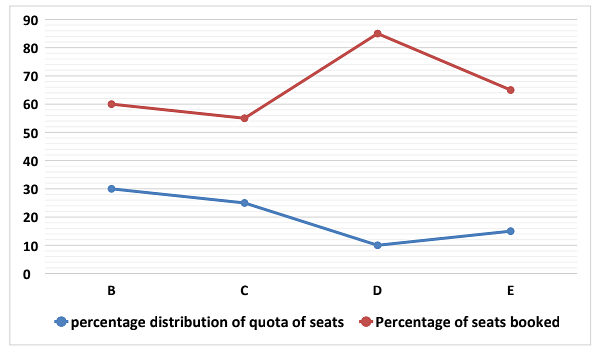
A train ‘T’ starts from station ‘A’ for station ‘F’. In between stations ‘A’ and ‘F’, there are four intermediate stations ‘B’, ‘C’, ‘D’ and ‘E’, respectively, in the same order. Stations ‘A’, ‘B’, ‘C’, ‘D’ and ‘E’ has quota for seats booking. The line graph given below represents the percentage distribution of quota of seats given to the respective stations out of total number of seats in the train and percentage of seats booked out of them.
The table below represents the total vacant seats in the train after leaving the respective stations.
| Stations | Total vacant seats |
|---|---|
| B | 562 |
| C | 494 |
| D | 514 |
| E | 472 |
Note:
1. When train left station A, number of vacant seats was 688 and 30% of quota seats of station A were not booked.
2. A seat can be booked for only one person from the respective stations and the same person can board the train from that station.
3. All the persons who booked tickets boarded the train.