Question
Question: Determine the graph of the equation \[y = 2x - 3\] ?...
Determine the graph of the equation y=2x−3 ?
Solution
To determine the graph we need different x values as well as their corresponding values of y. To solve this question, we take any value of x and then find the corresponding value of y and vice versa. In this way, we find two points and plot them on the graph and join them in order to get the graph of the equation.
Complete answer:
Given equation is y=2x−3
To plot a graph of the given equation y=2x−3, we need points.
To find the first point let us put x=0 and find the corresponding value of y.
On putting the value x=0 in the given equation.
y=2×0−3
On simplifying we get the value of y
⇒y=−3
This means when x=0, the value of y on the graph is −3. On observing the values of x and y we get the first point.
A be the first point. A=(0,−3)
To find the second point we put y=0 and find the corresponding value of x.
On putting the value y=0 in the given equation.
0=2×x−3
On taking 3 to another side
2×x=3
On simplifying we get the value of x
⇒x=23
⇒x=1.5
On observing the values of x and y we get the second point.
B be the first point. B=(1.5,0)
Now we make a table of these points.
| x | y |
|---|---|
| 0 | -3 |
| 1.5 | 0 |
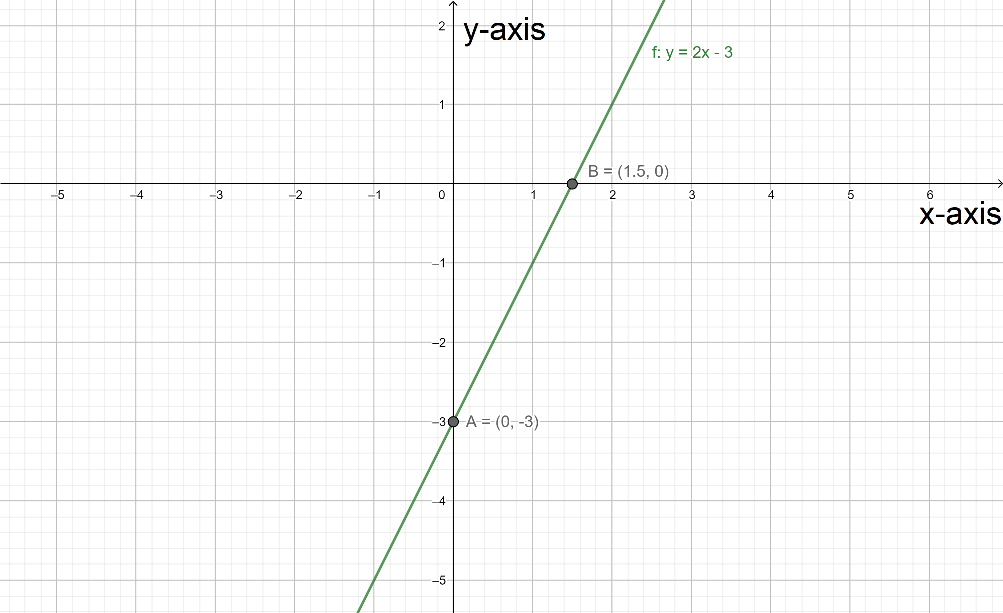
Now we put these points in the graph and join them to obtain the graph of the equation.
On putting these points in the graph. The graph looks like-
Note:
To plot the graph of the linear equation we need a minimum of two points but we are unable to make a line with a single point. More points are required if we make a curve then more points are required and with more points, our curve is more accurate.