Question
Question: Determine the angle of minimum deviation for a given prism by plotting a graph between the angle of ...
Determine the angle of minimum deviation for a given prism by plotting a graph between the angle of incidence and angle of deviation.
Solution
The refractive index can be found by taking the ratio of the sine of half of the sum of the angle of prism and angle of minimum deviation to the sine of the half of the angle of prism. Using this find the procedure to find the angle of minimum deviation and plot the graph.
Complete step by step answer:
Goal: to calculate the minimum deviation angle for a prism by plotting a graph between the angle of incidence and angle of deviation.
Theory: Refraction happens if a light ray travels from one medium to another which is resulting in the deviation of the emergent ray from that of the incident ray. The refractive index of the material used in the prism can be shown as,
n=sin(2A)sin(2A+δm)
Whereδmbe the angle of minimum deviation and A is the angle of the prism.
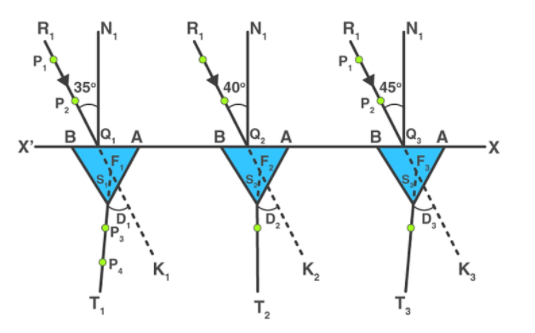
Procedure: keep the white sheet of paper on a drawing board and place it with the help of drawing pins. XX′ be the straight line which has been drawn parallel to the length of the paper such that it is in the middle of the paper. Mark the points Q1,Q2,Q3...on the straight line XX′each at a distance of 5cm. NQ1,NQ2... are the normal that are figured onQ1,Q2,Q3.... Create the angles of 35∘,40∘....60∘ by making straight linesR1Q1,R2Q2.... with respect to this normals. In order to take one edge of the prism for all the observation, consider one corner of the prism as A. fix the prism with its refracting face AB on the line XX′ and on the pointQ1 and also in the centre of AB. And also mark the boundary of the prism. On the line R1Q1, place pins vertically and mark them as P1 and P2. The distance between these pins must not be smaller than 10mm. Look for the images of the pointsP1 and P2, through the prism face, AC. Close our left eye and keep the right eye open, bring the two images in a line. Place the other two pins vertically and name them asP3 and P4. These pins must be 10cm apart from each other.P3 and P4 must be in one straight with respect to the images of P1 and P2. Mark the pricks of pinsP3 and P4. Repeat the steps 7 to 13 for the rest of the points for angle 40∘,45∘.....60∘.
Observation: the angle of prism A=60∘
| Serial no. | Angle of incidence(∘) | Angle of deviation(∘) |
|---|---|---|
| 1 | 35 | 10 |
| 2 | 40 | 20 |
| 3 | 45 | 30 |
| 4 | 50 | 40 |
| 5 | 55 | 50 |
| 6 | 60 | 60 |
The graph can be plotted like this,
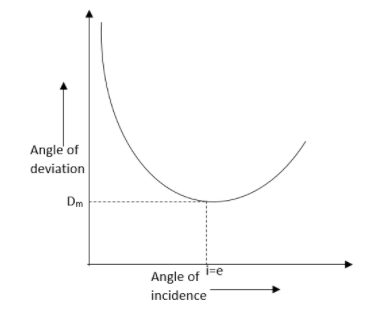
Result: the angle of minimum deviation is found. The graph has been plotted.
Note: This graph represents that the angle of incidence increases, the angle of deviation decreases first to attain the minimum value of δmand then increases as the angle of incidence increases.