Question
Question: Decomposition of $HI(g)$ on Gold surface is zero order reaction. Initially, few moles of $H_2$ are p...
Decomposition of HI(g) on Gold surface is zero order reaction. Initially, few moles of H2 are present in container then which of the following graph is correct?
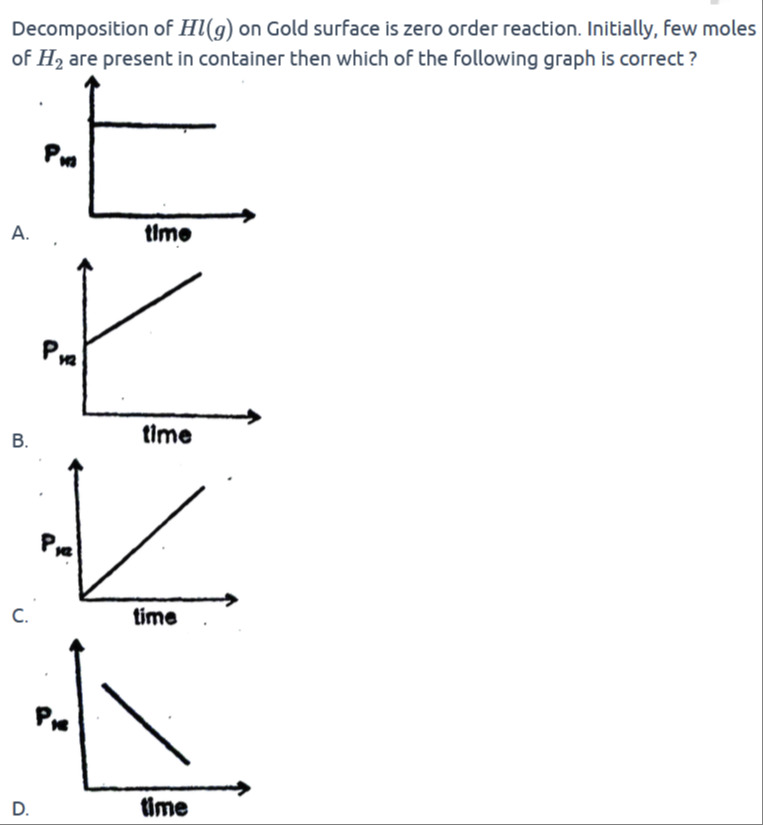
Graph A: A plot of PH2 versus time. The y-axis is labeled PH2 and the x-axis is labeled time. The graph shows a horizontal line, indicating that the partial pressure of H2 remains constant over time.
Graph B: A plot of PH2 versus time. The y-axis is labeled PH2 and the x-axis is labeled time. The graph shows a straight line with a positive slope, indicating that the partial pressure of H2 increases linearly with time, starting from a non-zero initial pressure.
Graph C: A plot of PH2 versus time. The y-axis is labeled PH2 and the x-axis is labeled time. The graph shows a straight line with a positive slope, indicating that the partial pressure of H2 increases linearly with time, starting from zero initial pressure.
Graph D: A plot of PH2 versus time. The y-axis is labeled PH2 and the x-axis is labeled time. The graph shows a straight line with a negative slope, indicating that the partial pressure of H2 decreases linearly with time.
Graph B: A plot of PH2 versus time. The y-axis is labeled PH2 and the x-axis is labeled time. The graph shows a straight line with a positive slope, indicating that the partial pressure of H2 increases linearly with time, starting from a non-zero initial pressure.
Solution
For a zero order reaction, the rate (rate = k) is constant and independent of reactant concentration. Thus, the amount of product (here, H₂) formed increases linearly with time according to:
PH2=PH20+kt
Since there is an initial amount of H₂ present (i.e., PH20=0), the graph will start from a non-zero value and increase linearly. This matches Graph B.