Question
Question: Construct a L.C.F and G.C.F curve for the following data. Marks obtained| \(0 - 5\)| \[5 - 10\]|...
Construct a L.C.F and G.C.F curve for the following data.
| Marks obtained | 0−5 | 5−10 | 10−15 | 15−20 | 20−25 |
|---|---|---|---|---|---|
| No. of Students | 10 | 3 | 5 | 2 | 2 |
Solution
In this question we will first make the cumulative frequency tables for both the given conditions and add the values for the respective condition, and then we have to plot the curve for both of them. Finally we get the required answer.
Complete step-by-step solution:
To the G.C.F and L.C.F of the following distribution we first need to make the cumulative frequency table for both the conditions.
The distribution table can be written as:
| Marks Obtained | No. of Students |
|---|---|
| 0−5 | 10 |
| 5−10 | 3 |
| 10−15 | 5 |
| 15−20 | 2 |
| 20−25 | 2 |
Now to make the table of G.C.F we will add all the succeeding values to the current value to make the table and to make the table of L.C.F we will add all the preceding values to the table, they would be made as:
First we have to find the G.C.F:
| Marks Obtained | No. of Students | Cumulative frequency |
|---|---|---|
| 0−5 | 10 | 10+3+5+2+2 |
| 5−10 | 3 | 10+3+5+2 |
| 10−15 | 5 | 10+3+5 |
| 15−20 | 2 | 10+3 |
| 20−25 | 2 | 10 |
Also, for the L.C.F:
| Marks Obtained | No. of Students | Cumulative frequency |
|---|---|---|
| 0−5 | 10 | 10 |
| 5−10 | 3 | 10+3 |
| 10−15 | 5 | 10+3+5 |
| 15−20 | 2 | 10+3+5+2 |
| 20−25 | 2 | 10+3+5+2+2 |
On adding the cumulative frequency value in both the tabulation and we get
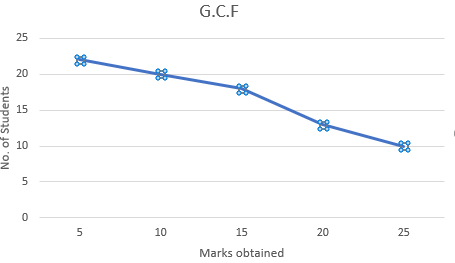
For the G.C.F:
| Marks Obtained | No. of Students | Cumulative frequency |
|---|---|---|
| 0−5 | 10 | 22 |
| 5−10 | 3 | 20 |
| 10−15 | 5 | 18 |
| 15−20 | 2 | 13 |
| 20−25 | 2 | 10 |
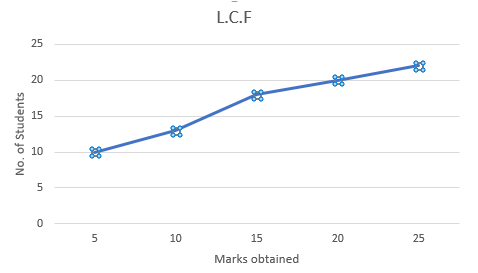
And for the L.C.F:
| Marks Obtained | No. of Students | Cumulative frequency |
|---|---|---|
| 0−5 | 10 | 10 |
| 5−10 | 3 | 13 |
| 10−15 | 5 | 18 |
| 15−20 | 2 | 20 |
| 20−25 | 2 | 22 |
Now, we have to plot the graph with taking the upper limit of Marks on X-axis and the respective cumulative frequency on the Y-axis to get the L.C.F and the G.C.F.
The points to be plotted to make the G.C.F on the graph are:
(5,22),(10,20),(15,18),(20,13),(25,10)
Also, the points to be plotted to make the G.C.F on the graph are:
(5,10),(10,13),(15,18),(2,20),(2,22)
Now for the G.C.F the curve is:
Also, for the L.C.F the curve is:
Therefore, the graphs are the required answer.
Note: L.C.F stands for a less than type cumulative frequency and G.C.F stands for a more than type cumulative frequency. The curve made using these is called a cumulative frequency curve or an ogive.
The cumulative frequency should always be plotted on the Y-axis to give the correct answer.
A very important application of making an ogive is finding the median of the distribution.