Question
Question: Consider the reaction $A \longrightarrow B$, graph between half-life $(t_{1/2})$ and initial concent...
Consider the reaction A⟶B, graph between half-life (t1/2) and initial concentration (a) of the reaction is:
Hence graph between −dtd[A] and time will be:
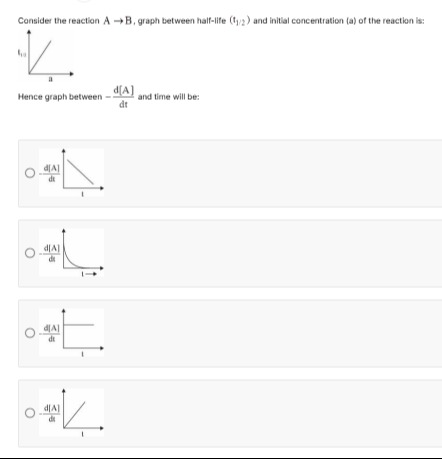
Option 1 shows a linearly decreasing rate.
Option 2 shows an exponentially decreasing rate.
Option 3 shows a constant rate (horizontal line).
Option 4 shows a linearly increasing rate.
Option 3
Solution
The initial graph shows that the half-life (t1/2) is directly proportional to the initial concentration (a). This relationship (t1/2∝a) is characteristic of a zero-order reaction. For a zero-order reaction, the rate law is given by Rate =−dtd[A]=k[A]0=k. This implies that the rate of the reaction is constant and does not change with time. Therefore, the graph of −dtd[A] versus time will be a horizontal straight line.