Question
Question: Consider the following graph between rate constant log (k) and $\frac{1}{T}$ ...
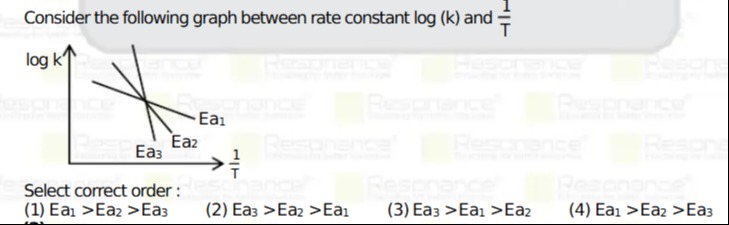
Consider the following graph between rate constant log (k) and T1
A
Ea1 >Ea2 > Ea3
B
Ea3 >Ea2 >Ea1
C
Ea3 >Ea1 >Ea2
D
Ea1 >Ea2 > Ea3
Answer
Ea3 >Ea2 >Ea1
Explanation
Solution
The Arrhenius equation in logarithmic form is given by
logk=−2.303REa⋅(T1)+logA.This shows that the slope of logk versus T1 is −2.303REa. A steeper (more negative) slope corresponds to a higher activation energy. Given that Ea3 has the steepest slope, followed by Ea2 and then Ea1 (which has the shallowest slope), the correct order is
Ea3>Ea2>Ea1.Core Explanation:
- Slope ∝−Ea.
- Steepest slope ⇒ highest Ea.
- Order: Ea3>Ea2>Ea1.