Question
Question: Avena curvature test was first of all done by (a)J.C.Bose (b)F.W.Went (c)Thimann (d)Skoog...
Avena curvature test was first of all done by
(a)J.C.Bose
(b)F.W.Went
(c)Thimann
(d)Skoog
Solution
First of all, a Dutch biologist performed the Avena curvature test. In 1958, at a time when he had become an internationally known expert on plant growth, he was appointed director of the Missouri Botanical Garden and professor of botany at Washington University in St Louis.
Complete answer:
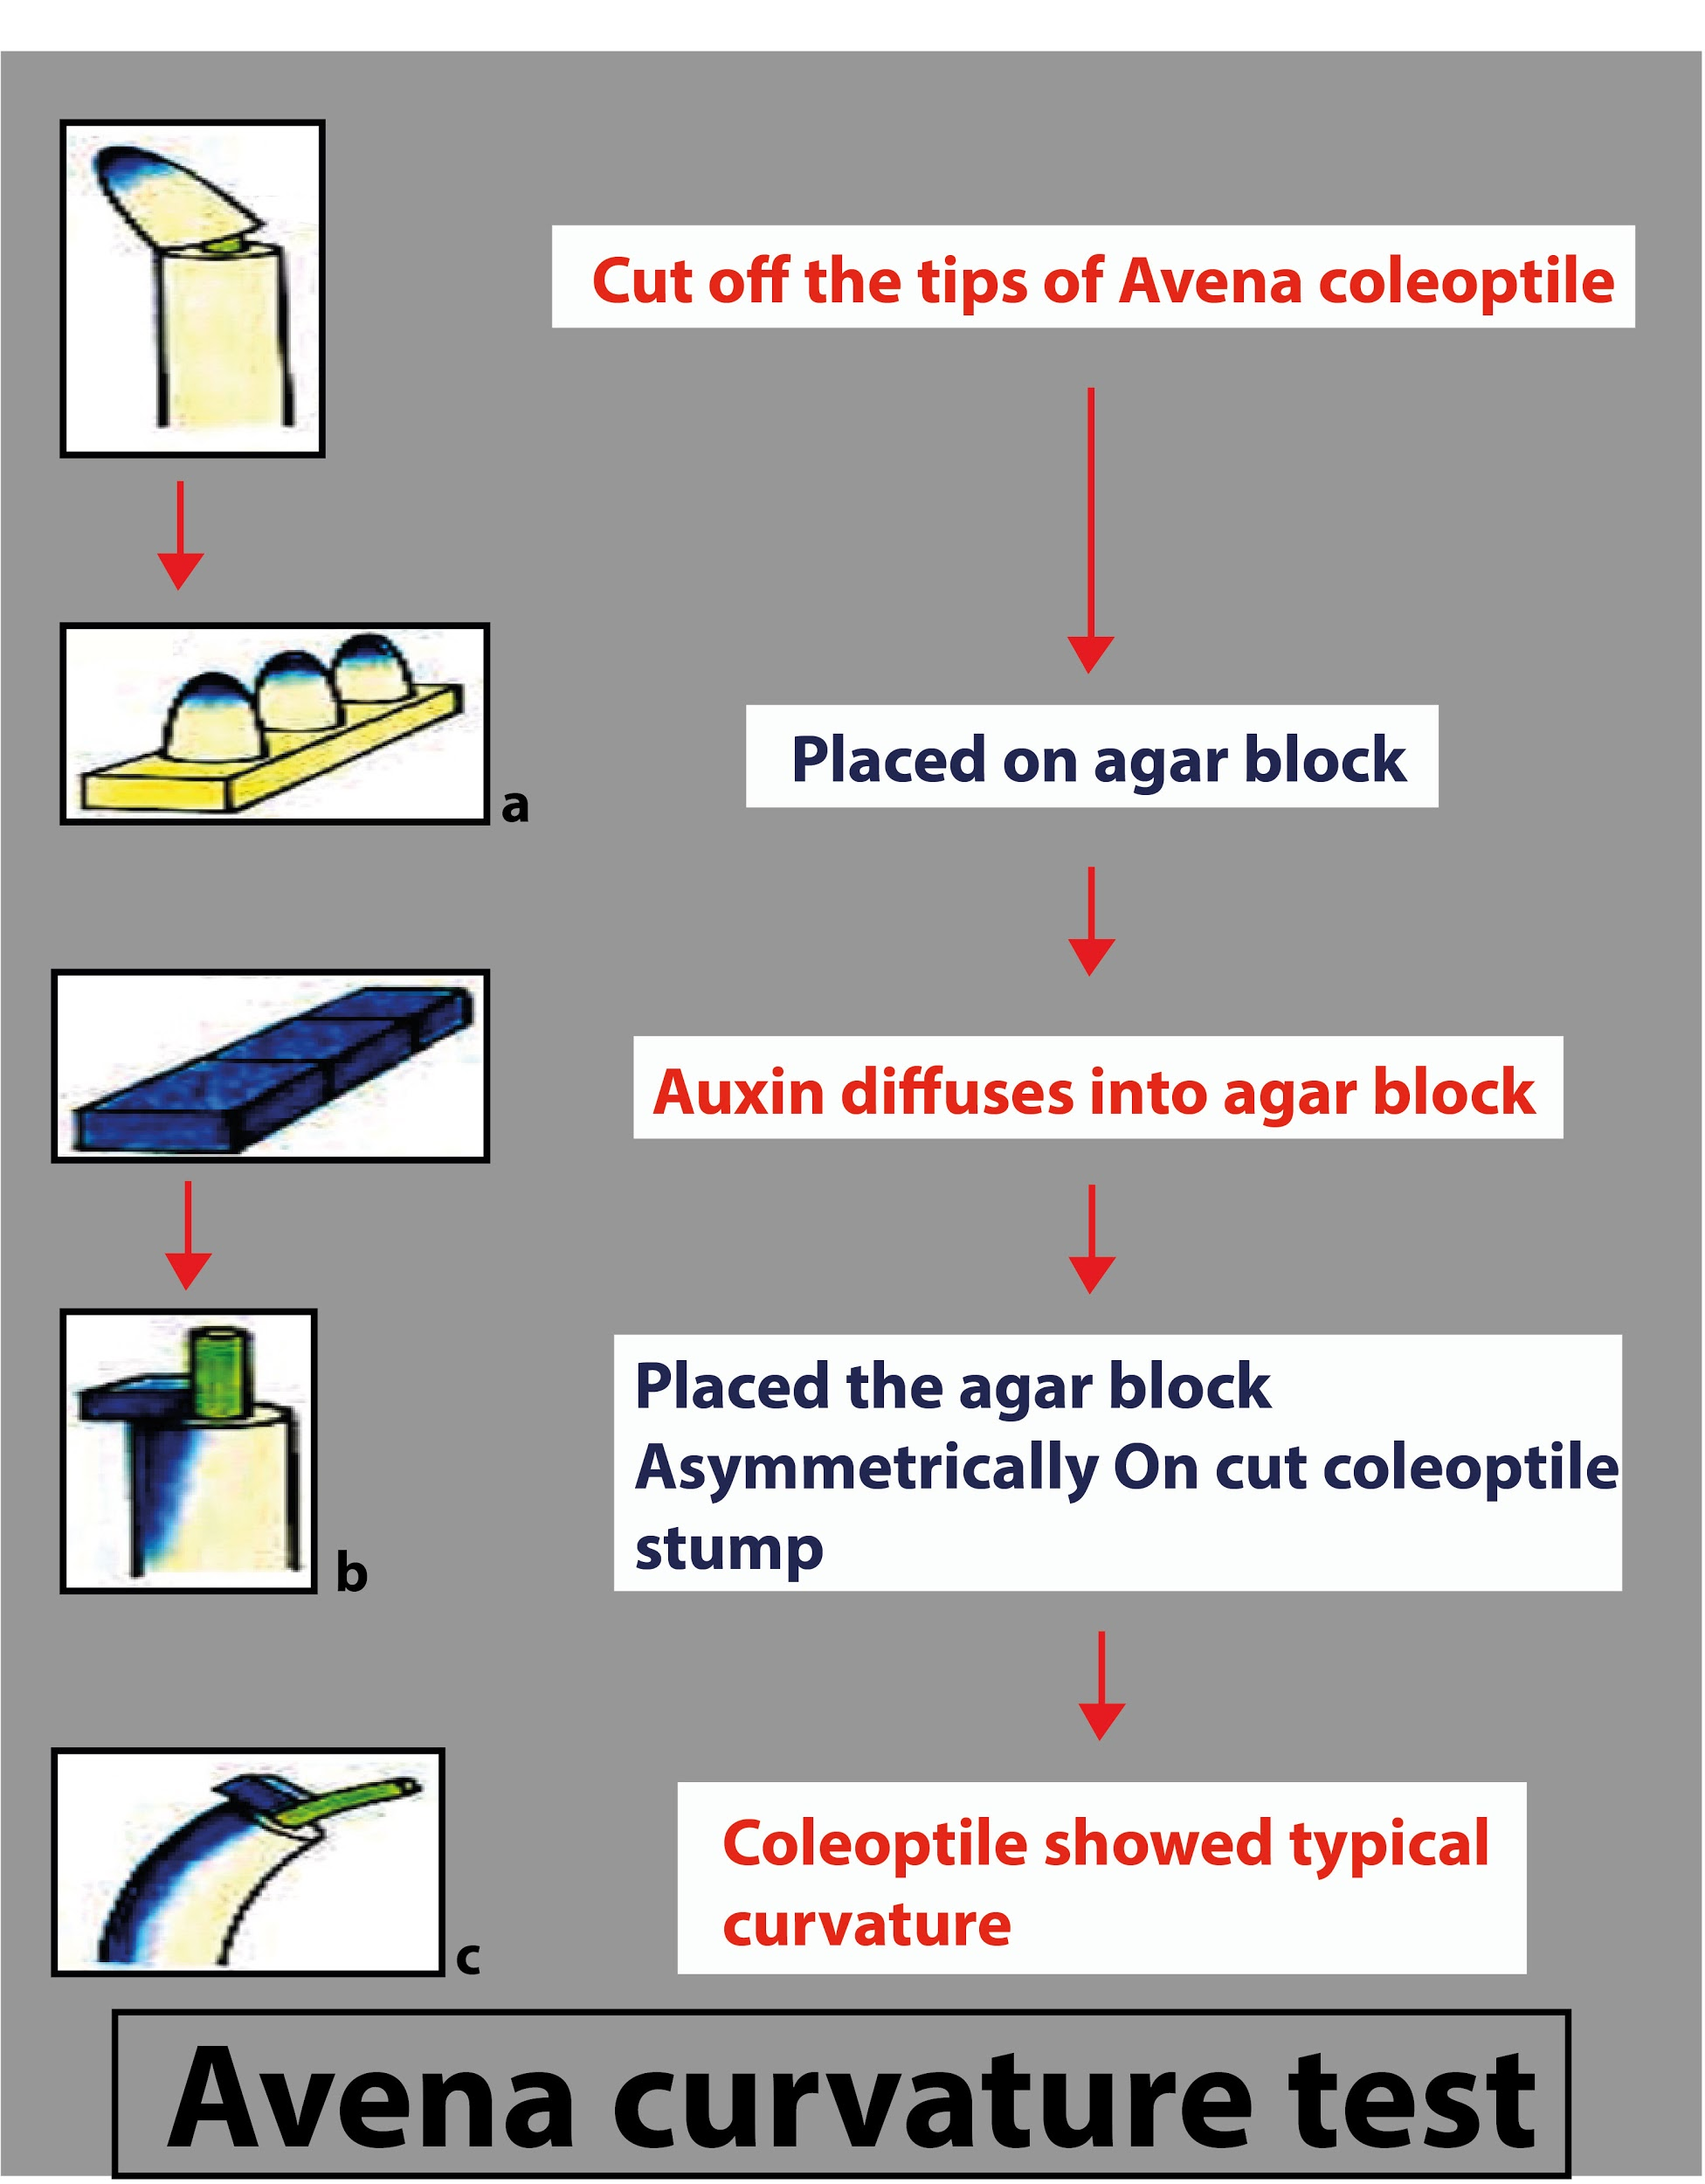
-The bioassay is a precise, sensitive test that determines the biological activity of hormones by measuring their effect on a precise part of the material of the plant. Different bioassays are available to assess the auxin hormone concentration in plants, such as the Avena curvature test, split pea stem curvature test, cress root inhibition test, etc.
-The Avena coleoptile test is, first of all, a bioassay by F.W. Went. This is for indole-3-acetic acid (IAA). After placing an agar block containing auxin on one side, it tests the angle of the curvature of a decapitated coleoptile.
-Frits Warmolt Went was a Dutch biologist (May 18, 1903-May 1, 1990) whose experiment in 1928 demonstrated the presence of auxin in plants.
-F. W. Went found that its elongation stops when the tip of the Avena coleoptile is cut. When auxin was added externally, however, it renewed its development. Through his experiments, he indicated that in the coleoptile tip, auxin is synthesized and translocated downwards towards gravity. It moves from the shaded side to the illuminated side.
On the shaded side, more auxin is contained than on the illuminated side. The plant grows more on the shaded side because of this and bends in the direction of the light source. Where faster cell elongation is seen on the shaded side and less on the illuminated side, this indicates positive phototropism.
So, the correct answer is, ‘F.W.Went’.
Note: Etiolated coleoptile oats are used and the test is carried out under diffuse daylight in unique perspex trays. In 4 series of 6 coleoptiles each, the coleoptiles, with the primary leaves intact, are arranged in grooves on the trays, and cut to 10 mm in size. The test substance is applied to an agar strip which covers only the lower halves of each set of apical cut surfaces. The coleoptile cylinders are graphed in shadow on a 35 mm photographic film after a 4-hour stay in the dark in moist Petri dishes. The curvatures are determined from an expanded projection of the shadow graphs (10 times the natural size). About 30 to 60 μg/l IAA is the lowest IAA concentration which can be established. A logarithmic course of up to 1,000 μg/l follows the concentration-response curves.