Question
Question: At time \(t = 0,\) some radioactive gas is injected into a sealed vessel. At times \(T\) some more o...
At time t=0, some radioactive gas is injected into a sealed vessel. At times T some more of the same gas injected into the same vessel. Which one of the following graphs best (represents the variation of the logarithm of the activity A of the gas with time t?
A.
B.

C.
D.
E.
Solution
Use the formula of decay in the mass of gas then take logarithm to both the sides to predict the graph.
N=Noe−λt
Complete step by step answer:
We know that the numerator of nuclei in a gas at time t is given by
Noe−λt
Where,
N is the number of nucleus of a gas at time t.
No is the initial number of nucleus at time t=0
λis the decay constant.
Since Ais given in the question, replace A with N and A0 with No, we get
A=A1e−λt
We need to find the variation in logarithm of A with respect to time.
Take logeto both sides of equation (1)
=logeA0+logee−λt(∵logab=loga+logb)
=logeA0−λtlogee(∵logab=bloga)
=logeA0−λt(∵logaa=1)
Now, logeA0 is constant
Put logeA0=k
And put logA=y
Then we get
y=k−λt
By rearranging, we get
y=−λt+k . . . . . (2)
Which is in the form,
y=mx+c
Which is a straight line of slope in equation (2) is a straight line of slope −λ
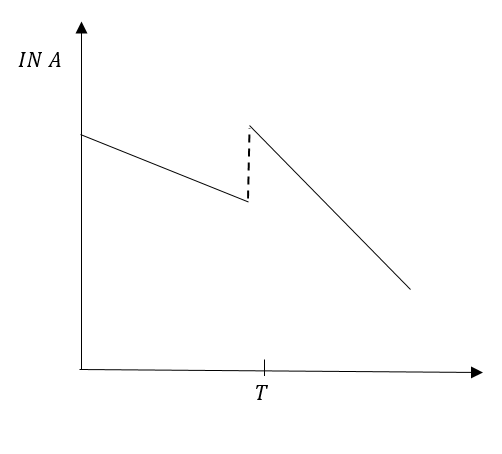
Since, more gas was added at time T. The graph of the straight line will break but the step of line will not change.
Graph in option (B) represents our conclusion in the best possible way.
So, the correct answer is “Option B”.
Note:
You need to understand the behaviour of graphs to solve such questions.
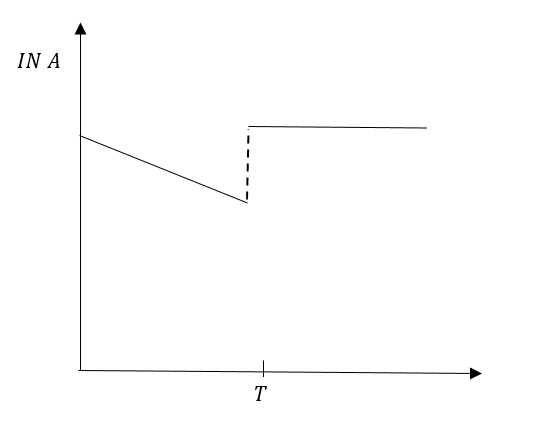
In option (A) the line is parallel to the axis after time T, that means the slope is zero. Therefore, option (A) IS INCORRECT.
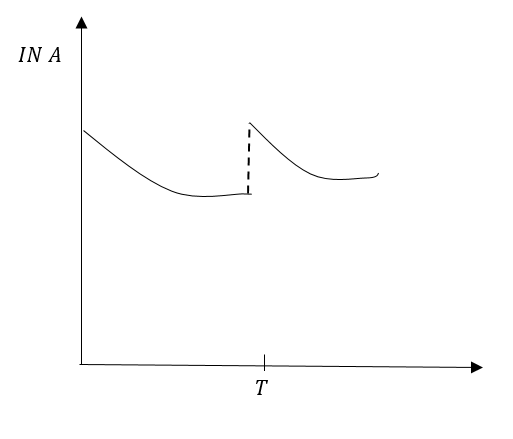
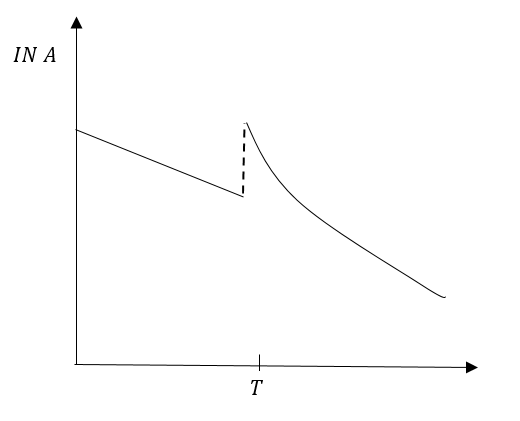
In option (C) the graph B is not a straight line that means the slope is changing at an energy point. Therefore, option (C) is moment.
In option (D0, inclination of line before time T and after time T is visibly different. That means the slope before time T and after time T is different. Therefore, option (D) is incorrect.
In option (A), graph before time T is a straight line but the graph after time T is not correct. Therefore, option (C) IS INCORRECT.