Question
Question: At Boyle's temperature, the graph of Z v/s P is drawn for $H_2$. Select incorrect graph(s): ...
At Boyle's temperature, the graph of Z v/s P is drawn for H2. Select incorrect graph(s):
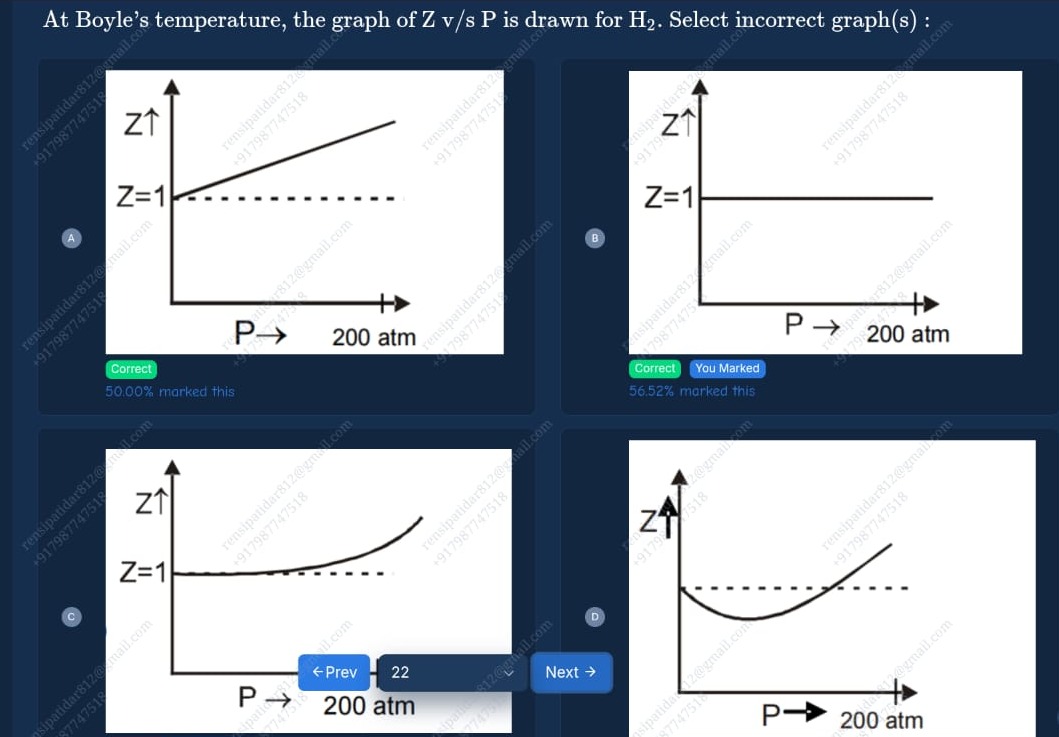
Graph A: Z starts at 1 and increases linearly with P.
Graph B: Z is constant at 1 for all pressures.
Graph C: Z starts at 1 at P=0 and increases with pressure. The curve is concave up
Graph D: Z starts at 1 at P=0, initially decreases below 1, reaches a minimum, and then increases.
A, B, D
Solution
The compressibility factor Z is defined as Z=nRTPV. For a real gas, the virial equation of state can be written as Z=1+B2(T)P+C2(T)P2+….
Boyle's temperature (TB) is the temperature at which the second virial coefficient B2(TB)=0.
At Boyle's temperature, the virial equation becomes Z=1+C2(TB)P2+D2(TB)P3+…
For most gases, the third virial coefficient C2(T) is positive. For H2, C2(TB)>0.
Therefore, at Boyle's temperature and low pressures, Z≈1+C2(TB)P2. Since C2(TB)>0, Z starts at 1 at P=0 and increases with pressure. The initial slope dPdZ at P=0 is zero, since dPdZ=2C2(TB)P+…, which is 0 at P=0. The curve of Z vs P is initially concave up as the second derivative dP2d2Z=2C2(TB)+… is positive at low pressure.
Let's analyze the given graphs:
-
Graph A: Z starts at 1 and increases linearly with P. This would imply Z=1+kP with k>0. The initial slope is constant and positive, which contradicts the behavior at Boyle's temperature where the initial slope is zero. So, Graph A is incorrect.
-
Graph B: Z is constant at 1 for all pressures. This represents an ideal gas, not a real gas like H2 at Boyle's temperature over a range of pressures. While B2(TB)=0, higher order terms are non-zero, so Z deviates from 1 as pressure increases. So, Graph B is incorrect.
-
Graph C: Z starts at 1 at P=0 and increases with pressure. The curve is concave up, consistent with Z≈1+CP2 at low pressures where C>0. This graph correctly represents the behavior of H2 at its Boyle's temperature.
-
Graph D: Z starts at 1 at P=0, initially decreases below 1, reaches a minimum, and then increases. This behavior occurs at temperatures below the Boyle temperature, where attractive forces dominate at low pressures, leading to Z<1. At Boyle's temperature, Z is always greater than or equal to 1 (at P=0, Z=1; at P>0, Z>1). So, Graph D is incorrect.
The question asks to select the incorrect graph(s). Based on our analysis, graphs A, B, and D are incorrect.