Question
Question: Arrhenius equation is \(k=A{{e}^{\dfrac{-{{E}_{a}}}{RT}}}\). Which of the following graphs represent...
Arrhenius equation is k=AeRT−Ea. Which of the following graphs represents the variation of rate constant k against the temperature T?
(A) 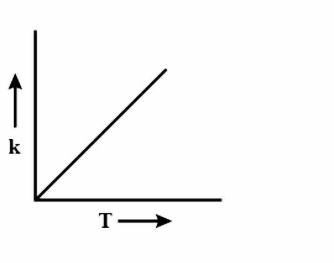
(B) 
(C) 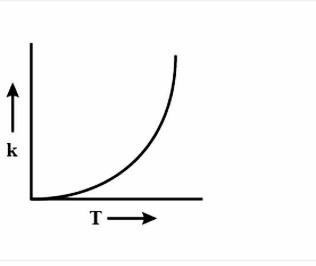
(D) 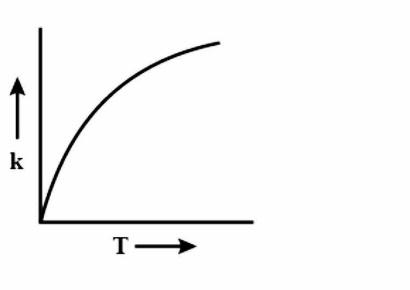
Solution
Note: You must recall the fact that when the temperature is increased in a chemical reaction, then the rate constant also increases. For every 100 rise in temperature, the rate constant gets nearly doubled.
Complete Step-by-step solution:
First, let us recall the Arrhenius Equation for chemical kinetics. The Arrhenius equation is represented as:
k=AeRT−Ea , k is the rate constant,
A is the Arrhenius factor,
Ea is the activation energy.
During every chemical reaction, an intermediate is formed, in the beginning. In order for the intermediate to form, some energy is required and this energy is called the Activation energy. A lot of collisions happen between the molecules during the reaction and these collisions are responsible for formation of the products. Now, if the temperature is increased, then heat is transferred in the form of Kinetic energy. The fraction of molecules which collide increases, which have energy more than the activation energy Ea. As the graph is increasing, so accordingly the options are eliminated. Now to figure out the shape of the graph, we have to again look at the equation i.e k=AeRT−Ea. Clearly, the equation is an exponential graph so it will be curved and not be in a straight line. Hence, it is either B or D. The last thing we can look at is the sign of the exponent.
We can observe that it is a negative exponential power graph, so in that case, our answer will be option C, i.e negative exponential.
Note: No chemical reaction can occur if the fraction of molecules have energies less than the activation energy Ea. Moreover, you can put random values of k and Ea, A in the equation and check which graph satisfies it, in case time is less during the exam.