Question
Chemistry Question on Enthalpy change
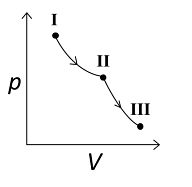
An ideal gas undergoes a reversible isothermal expansion from the state I to state II followed by a reversible adiabatic expansion from state II to state III. The correct plot(s) representing the changes from the state I to state III is(are)
(p : pressure, V : volume, T : temperature, H : enthalpy, S : entropy)
A
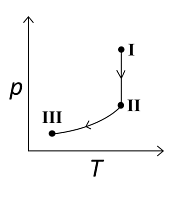
B
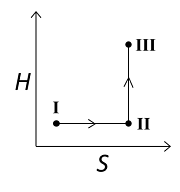
C
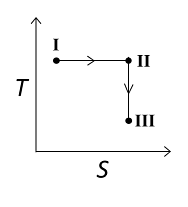
D
Answer
Explanation
Solution
For the reversible isothermal expansion from state I to II:
- Pressure decreases
- Volume increases
- Temperature remains constant
- Enthalpy (H) remains constant
- Entropy (S) increases
So, all options are correct for this expansion.
For the reversible adiabatic expansion from state II to III:
- Pressure decreases
- Volume increases
- Temperature decreases
- Enthalpy (H) decreases
- Entropy (S) remains constant
Option (C) does not follow the condition of decreasing enthalpy, so it is incorrect. Options (A), (B), and (D) all follow the conditions, so they are correct.
Therefore, correct graphical representations for the given conditions are (A) , (B) , and (D).