Question
Question: An ideal gas goes through a reversible cycle \(a \to b \to c \to d\) has the V- T diagram shown belo...
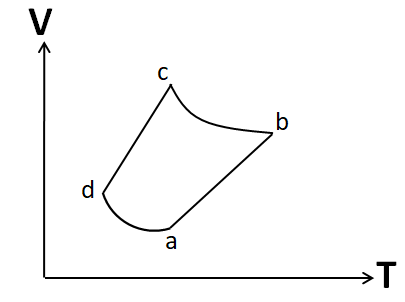
An ideal gas goes through a reversible cycle a→b→c→d has the V- T diagram shown below. Process d→a and b→c are adiabatic. The corresponding P- V diagram for the process is (all figures are schematic and not drawn to scale).
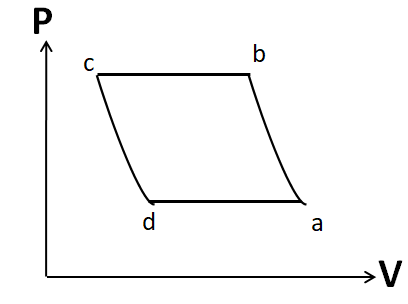
(A)
(B)
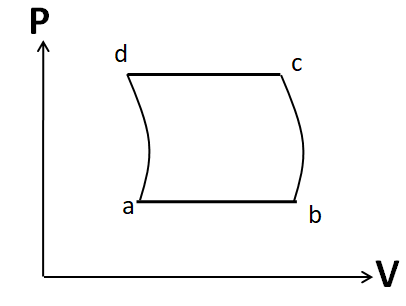
(C)
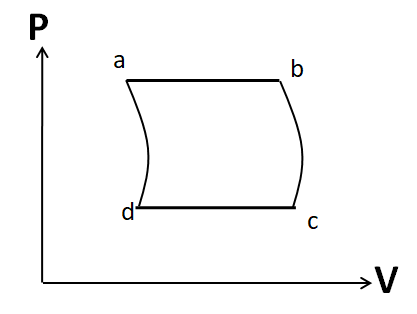
(D)
Solution
To solve this question, we need to obtain the equation for each of the four processes given in the cycle. We also have to use the ideal equation for identifying each process.
Complete step-by-step solution:
Process a to b:
In the given V-T diagram, the process a-b is represented by a straight line. From the ideal gas equation we have
PV=nRT
⇒T=nRPV
Comparing with the equation of the straight line y=mx, we have the slope of the diagram for this process as
mab=nRP
Since the slope of a straight line is a constant, so we have
nRP=constant
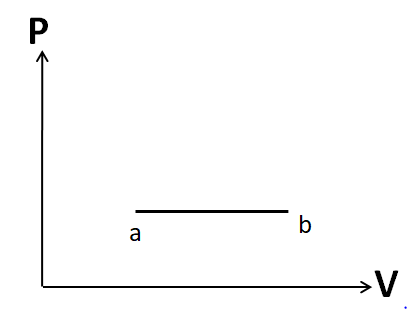
Since the number of moles is constant, we have a constant pressure. So this process is isobaric. Hence it must be represented by a horizontal line. So the P-V diagram for this process will look like
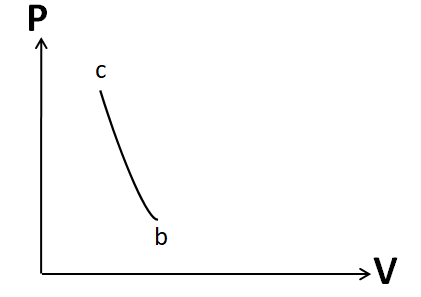
Process b to c:
According to the question, this process is adiabatic. We know that the adiabatic process is represented by the equation
PVγ=Constant
So we can write
P=Vγk
So the P-V graph for this process will look like
Similarly, we can show that the process c to d is also isobaric. So its P-V graph will be similar to the P-V graph of the process a to b.
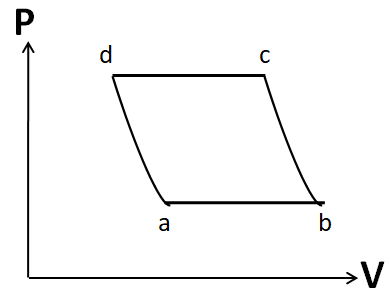
Also the process d to a is given to be adiabatic. So its P-V graph will be similar to that of the process b to c. Hence, the P-V graph for the cycle given in the question is

Hence, the correct answer is option D.
Note: It is important to draw the P-V plot in the same order as that given in the question. Otherwise you may get the same shape, but due to a different order you may tick the incorrect option. For example, the P-V diagram given in option A is similar to that in the correct option D. But it has different order.