Question
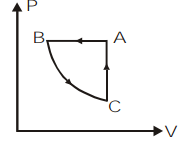
Question: \[ABCA\] is a cyclic process. Its \[P-V\] graph would be 
A)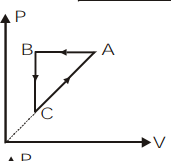
B)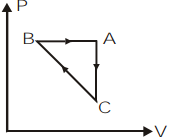
C)
D)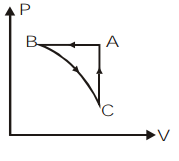
Solution
We will use the ideal gas relation PV∝nT for analysis of all three processes given in the P−T graph and convert the data into P−V graph. The given process ABCA is a cyclic process but it is completing one cycle with 3 processes. So we will need to convert each process separately.
Complete step by step answer:
The given process ABCA completes one cycle by undergoing 3 cycles as BC, CA and AB. We can plot the P−V graph of the given process by analyzing the given P−T graph individually for each process.
Let us take the first process BC on the P−T graph. We can observe that the temperature remains constant for this process and pressure is decreasing. So by the ideal gas equation, at constant temperature, P∝V1. So as the pressure is decreasing, the volume will increase.
Now, let us take the process CA on the P−T graph. Here, we can observe the temperature and pressure increasing as per the ideal gas relation P∝T. But this relation is valid only at constant volume. So in the P−V graph there will be no change in volume.
Then, we will consider the last process in this cyclic process which is AB. If we look at the P−T graph of this process we can understand that pressure remains constant and temperature is decreasing. So, according to the ideal gas relation, at constant pressure, V∝T. That means the volume will decrease. So in the P−V graph the pressure remains constant and volume will decrease.
So, we can plot the P−V graph of the given cyclic process ABCA as,
So, the correct answer is option c.
Note:
We can solve this question only by using the relationship between the parameters given by the ideal gas equation. But we can solve this question quickly by just analyzing each process and the variations occurring in that process and converting it to the desired plot if we know the relation between P, V and T according to the ideal gas relation.