Question
Question: A woman starts from her home at 9.00 am, walks with a speed of \(5km/hr\) on a straight road up to h...
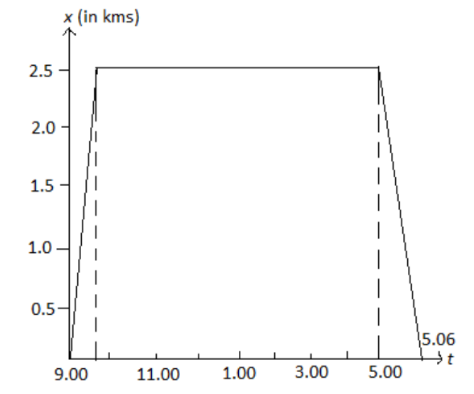
A woman starts from her home at 9.00 am, walks with a speed of 5km/hr on a straight road up to her office 2.5 km away, stays at the office up to 5.00 pm, and returns home by an auto with a speed of 25km/hr. Plot the position-time graph of the woman taking her home as origin.
Solution
In order to solve the question, write down all the given physical quantities and apply the formula of speed we can find the required solution. By finding the time taken by the woman we can draw the required position-time graph of the woman taking her home as origin.
Formula Used:
Speed =TimeDistance
Complete answer:
It is given that the speed of the woman is 5km/hr.
Distance in between her office and home is 25km.
Therefore, total time taken to complete the distance between her office and home with the given speed is given by,
Total time taken =SpeedDistance
=52.5=0.5hr=30min.
According to the question, in the evening she covers the same distance by an auto.
It is given that the speed of the auto is 25km/hr.
Therefore, total time taken to complete the distance between her office and home in the evening by an auto with the given speed is given by,
Total time taken =SpeedDistance
=252.5=0.1hr=6min.
Hence, below is the required position-time graph of the woman taking her home as origin.
Additional Information:
Velocity gives us information about the rate of change of the position of the body, meaning how fast the position of the body is changing per unit time. In physics, the velocity is defined as the displacement divided by time where displacement is defined as the difference between the final and initial positions of the body.
An object which is moving with variable velocity, for that average velocity is defined as the ratio of its total displacement to the total time interval in which that displacement occurs. A body is said to be moving with variable velocity if either its speed changes or direction of motion changes or both change with time.
Note:
In a position – time graph, the vertical axis represents the position of the object or the body or of a person while the horizontal axis represents the time taken to complete the distance.