Question
Question: A uniform metal rod is fixed at one end to a rigid support and its temperature is gradually increase...
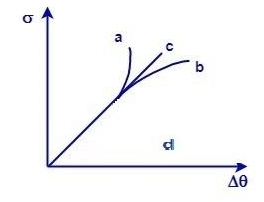
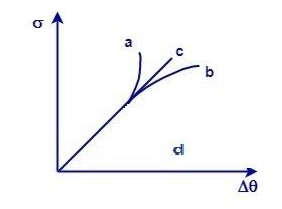
A uniform metal rod is fixed at one end to a rigid support and its temperature is gradually increased. If a plot be made of the stress (σ) versus increment in temperature Δθ , which curve best represents it?
(A) a
(B) b
(C) c
(D) d
Solution
Use the formula of length expansion due to application of temperature on a metal rod i.e.
⇒l′=l(1+αΔθ)
Where, l′ is the increased length of metal rod,
l is the original length of the metal rod,
α is the linear coefficient of expansion,
Δθ is the change in temperature.
Complete step by step solution
Length expansion in the given uniform metallic rod is given by:
⇒l′=l(1+αΔθ)
⇒l′=l+lαΔθ⇒l′−l=lαΔθ⇒ll′−l=αΔθ⇒lΔl=αΔθ
But lΔl=Strain
So Strain=αΔθ
Also we know that the elasticity of a body is given by:
⇒Y=StrainStress(σ)
⇒σ=Y×Strain⇒σ=YαΔθ ..................... (1)
We can clearly see in the equation (1) that stress is directly proportional to the change in temperature.
Hence the graph plotted between them will be linear in shape.
From the given options curve c i.e. option (C) is the required graph.
Note
Stress is the magnitude of force that causes the deformation in the body and is equal to the pressure applied. With the increase in temperature, the length of the rod increases and hence, the force of deformation i.e. stress is also increased on the body.