Question
Question: A thin uniform rod, pivoted at O, is rotating in the horizontal plane with constant angular speed \[...
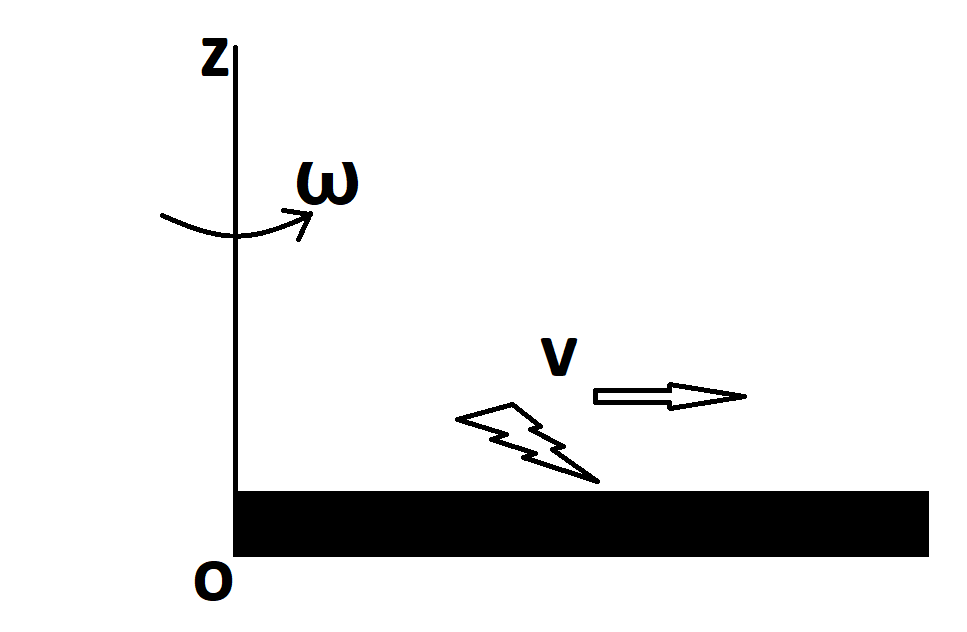
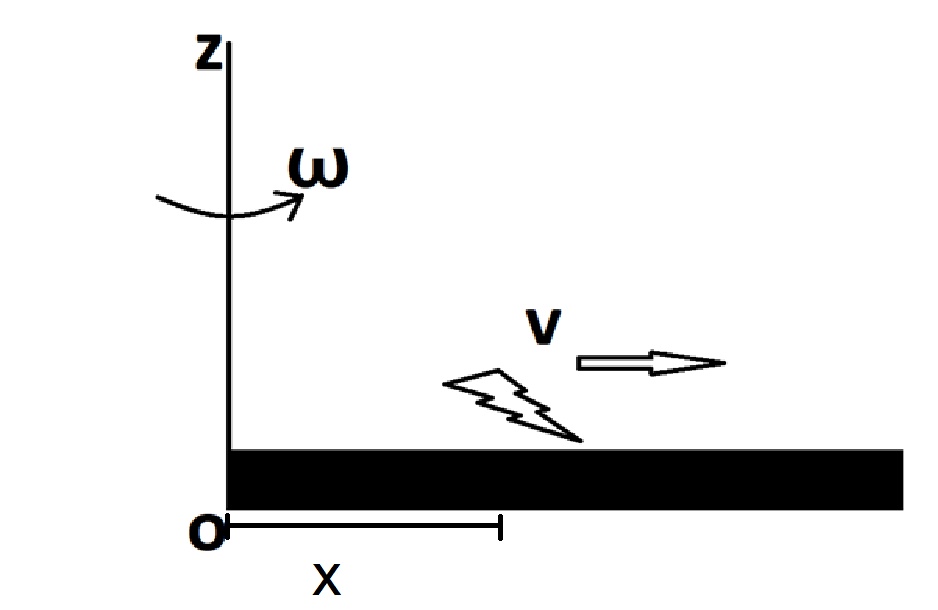
A thin uniform rod, pivoted at O, is rotating in the horizontal plane with constant angular speed ω , as shown in the figure. At time t = 0, a small insect starts from O and moves with constant speed v, with respect to the rod towards the other end. It reaches the end of the rod at t =T and stops. The angular speed of the system remains ω throughout. The magnitude of the torque (∣π∣) about O, as a function of time is best represented by which plot?
A.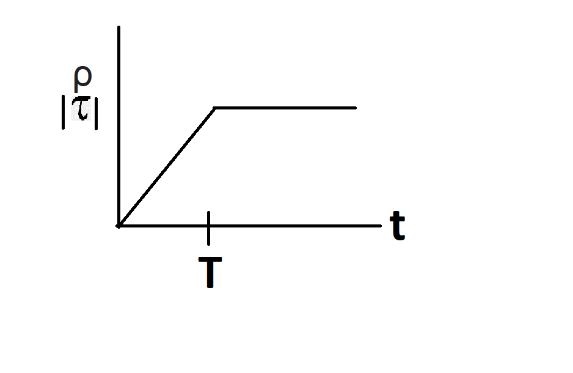
B. 
C.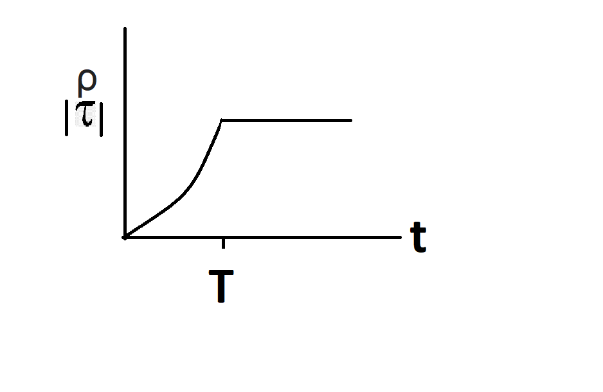
D. 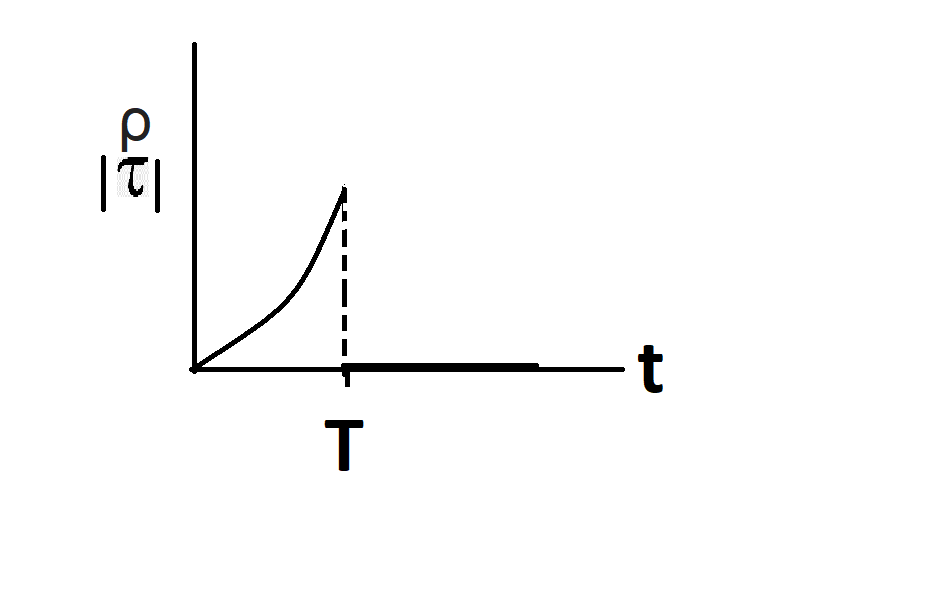
Solution
This question is a case of hinged rotational motion. To get the correct answer you have to find out the relationship between τand time. For that you can proceed by using the formula for τ and moment of inertia. Remember that ∣r∣=∣dtdL∣. Also, remember the moment of inertia will be that of rod, i.e., 31ML2 plus that of the mx2 for the object where x is an arbitrary distance.
Complete answer:
As we know,
∣r∣=∣dtdL∣
Where
L=Iω
So,
Now,
It is obvious from the scenario that the moment of inertia is
The (rod + insect) scheme is increasing.
Let the insect be at a distance xx at any moment in time,' t'
Of O. At this time, the time of the inertia of the moment,
The scheme is
So,
Then
τ=dtd(Iω)=ωdtdl
Therefore,
I=31ML2+mx2............ ……………. (ii)
Now,
By using the equations (i) and (ii)
We have
τ=ωdtd[31ML2+mx2]
⇒τ=ωmdtdx2
⇒τ=ωm2xdtdx
⇒τ=2ωmxu
⇒τ=2ωmv2t
So,
Form the above equation, we can easily conclude that
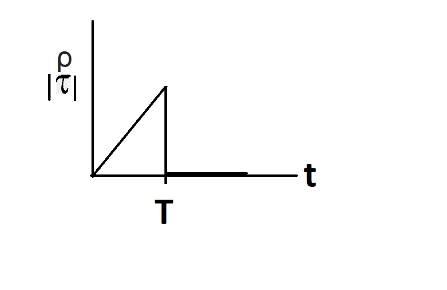
τ∝t
At t=T, υ=0.
Therefore, τ=0
Hence, the graph between τ and tis a straight line till t=T. Also, for, t>T, τ=0
Option - B is the correct option.
Note:
As you can see, the final result was τ∝t that can be written as τ=ktwhere k is some constant. So, the graph will be that of a straight line. While in exam, you can sometimes save your time by eliminating the options which have any curve other than the straight line.