Question
Question: A thermodynamic cycle xyzx is shown on a V−T diagram. The P−V diagram that best describes this cycle...
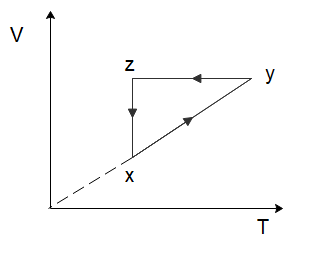
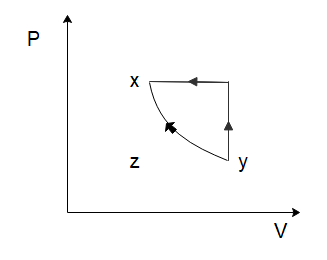
A thermodynamic cycle xyzx is shown on a V−T diagram. The P−V diagram that best describes this cycle is: (Diagrams are schematic and not to scale)
(A)
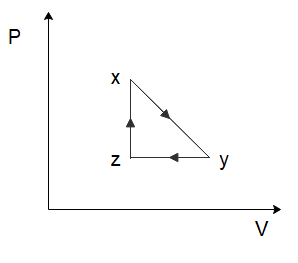
(B)
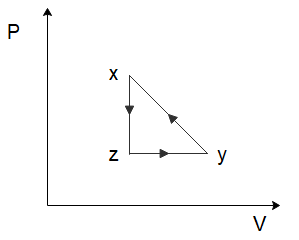
(C)
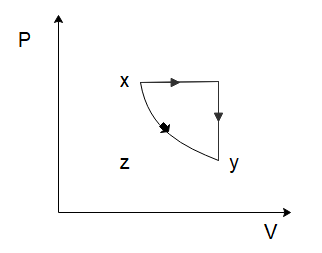
(D)
Solution
In this solution, we will use the ideal gas formula to determine the relationship between pressure-volume and temperature. For each process, we will determine which quantity remains constant and which quantity changes.
Formula used: In this solution, we will use the following formula:
-Ideal gas law: PV=nRT where P is the pressure, V is the volume, n is the number of moles, Ris the gas constant, and T is the temperature
Complete step by step answer:
To solve this problem let us start by considering the process of x→y. From the graph, we can see that both the temperature and the volume of the gas are increasing. Now in the relation PV=nRT, n and R are constants. So, if the temperature and the volume both increase, the pressure would have to remain constant for the equation to hold true. So, for the process x→y, the pressure will remain constant while the volume increases. Among the options given to us, this is only shown in option (C).
So the correct option is C
Note: Often, we cannot determine the correct choice from just one process, so let us determine the graphs of the other processes as well.
In the process y→z, we can see that the volume of the gas remains constant, while the temperature of the gas decreases. Again, from the ideal gas law, we can deduce that the pressure of the gas would have to decrease to ensure the ideal gas law holds true. So, the pressure decreases, and the volume of the gas remains constant which is again only shown in option (C).