Question
Question: A survey was carried out to find the favourite beverage preferred by a certain group of young people...
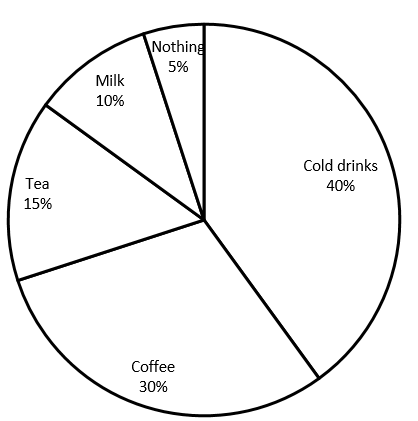
A survey was carried out to find the favourite beverage preferred by a certain group of young people. The following pie chart shows the findings of this survey. From this pie chart answer the following:
(i) Which type of beverage is liked by the maximum number of people?
(ii) If 45 people like tea, how many people were surveyed?
(iii) Find the number of people who like coffee in the total number of people surveyed.
Solution
The given question is based on the topic data interpretation in which collected numerical data is analysed and interpreted. This collection may be represented either in table or in graphs and diagrams. Pie-chart or pie-graph is the method of representing a given numerical data in the form of sectors of a circle. These types of questions are easy to solve just by looking at the chart and with simple calculations. Here also we are going to answer the given questions just by observing the pie-chart.
Complete answer:
From the pie-chart it is clear that cold drinks is liked by 40% of people, coffee is liked by 30% of people, tea is liked by 15% of people, milk is liked by 10% of people and 5% people don’t like any kind of beverages.
(i) Which type of beverage is liked by the maximum number of people?
The maximum percentage in the pie-chart is 40%, so obviously 40% gives the maximum number of people. Therefore, the maximum number of cold drinks is the beverage liked by the maximum number of people by 40%.
(ii) If 45 people like tea, how many people were surveyed?
The percentage of people who liked tea given in the pie-chart is 15%, and now it is given to 45 people out of the total number of people surveyed. And we are asked to find the total number of people surveyed.
That is, tea is liked by 45⇒15% in the total number of people surveyed.
∴10015×total number of people = 45
Cancelling both 15 and 100 by 5 we will get,
203×total number of people = 45
If 203 goes that side of equal then it becomes 320,
total number of people = 45×320
Cancelling 45 by the denominator 3,
=15×20
=300.
∴The total number of people surveyed is 300.
(iii) Find the number of people who like coffee in the total number of people surveyed.
Here we are asked to find the total number of people who like coffee. It is given in the pie-chart that coffee is liked by 30% of people. Let's consider the number of people who like coffee as x.
We have already found that the total number of people surveyed is 300.
∴x=10030×total number of people
=10030×300
By cancelling zeroes in 100 and 300 ,
=30×3
=90.
Hence, 90 people like coffee.
Note:
Pie-charts are effective for showing percentage (parts of a whole) but they are ineffective in showing quantities, totals or comparisons. Here the numerical data are represented in the form of percentage (%) therefore total percentage % is always out of 100% and the formula based on the percentage is: results on percentage=100percentage obtained×total.