Question
Question: A realtor is studying the figure above, which shows the expected value of properties in her area ove...
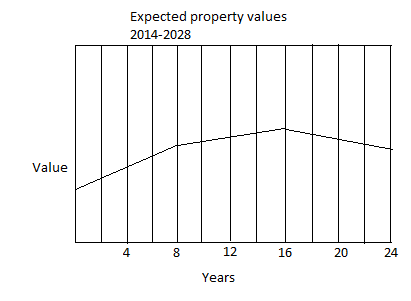
A realtor is studying the figure above, which shows the expected value of properties in her area over the next 24 years .If it represents the number of years after 2014, in what year should the increase in property value start to slow down?
(A) 2008
(B) 2018
(C) 2022
(D) 2030
Solution
In this question, the property values are given for specific years in graphical representation and the starting year also given.
We have to find out the year where the increase in property value starts to slow down.
We need to first observe the graph and find out the year where the increase in property value starts to slow down then we need to add that year with the starting year.
Complete step by step solution:
The given observations are the graphical representation of the expected property values from year 2014−2028.
We need to find out the year where the increase in property value starts to slow down.
We can see in the graph that the expected property values are going up till the year 16 after that it is going down.
The graph starts from the year 2014.
Thus the increase in property value start to slow down in 2014+16=2030
∴ Option (D) is the correct option.
Note: Graphical representation:
Graphical representation refers to the use of charts and graphs to visually display, analyse, clarify, and interpret numerical data, functions, and other qualitative structures. Data is ingested into graphical representation of data software and then represented by a variety of symbols, such as lines on a line chart, bars on a bar chart, or slices on a pie chart, from which users can gain greater insight than by numerical analysis alone.