Question
Question: A radioactive sample consists of two distinct species having equal numbers of atoms initially. The m...
A radioactive sample consists of two distinct species having equal numbers of atoms initially. The mean lifetime of one species is τ and that of the other is 5τ. The decay products in both cases are stable. A plot is made of the total number of radioactive nuclei as a function of time. Which of the following figures best represents the form of this plot?


Solution
The graphs are given on the basis of the radioactivity. In radioactivity the nucleus emits particles when it is unstable and keeps on emitting particles exponentially with time in order to attain stability. Hence the graph which will show continuous decreasing in number of nuclei with time exponentially will be the solution of this question.
Complete step by step answer:
Step 1:
Radioactivity refers to the particles which are emitted from nuclei as a result of nuclear instability. The most common types of radiation are called alpha, beta, and gamma radiation, but there are several other varieties of radioactive decay.
The special thing about the radioactive element is that they decay with time and emit their particles.
They keep on doing this process until they achieve a stable state and then stop emitting particles.
Step 2:
We are given:
A radioactive sample consists of two distinct species having equal numbers of atoms initially.
The mean lifetime of one species is τ and that of the other is 5τ
And also the decay products in both cases are stable
Let us check one by one which graph from the given graph satisfies the given defenestration of the radioactive material.

In this diagram we can see that with the time changing there is no change in the nuclei of the atoms up to τ and according to the definition it is not possible. They will keep on emitting particles until stability reaches.
So there is no case for the constant of nuclei with time. Hence A is not the answer.

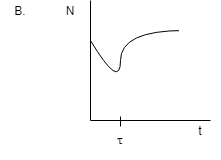
Coming to the second diagram:
From the diagram we can see that the number of nuclei is decreasing up to theτ. This is according to our definition but after that with the passing of the time the number of nuclei starts increasing. This thing is not possible in radioactivity because they only emit particles and do not stop until stability.
Hence B is not the answer.

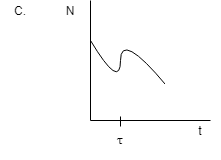
Now, for the third diagram:
Decaying means decreasing and hence there is no provision for decreasing and then increasing and then again decreasing which is shown in the diagram. The suitable diagram will be in which the particles are decreasing with time.
And hence C is also not the correct option.

In radioactivity, particles are emitted from nuclei as a result of nuclear instability and keep on emitting it until stability. In the given diagram we can see that the nucleus is emitting continuously and decreasing exponentially with time and there are no increasing-decreasing lines and it fits into our definition of radioactivity.
Hence D is the correct option.
Note:
Natural radioactivity is a purely nuclear phenomenon. The nucleus of a radioactive substance is unstable and such an unstable nucleus undergoes spontaneous breakdown (disintegration). The process continues until a stable nucleus is obtained.